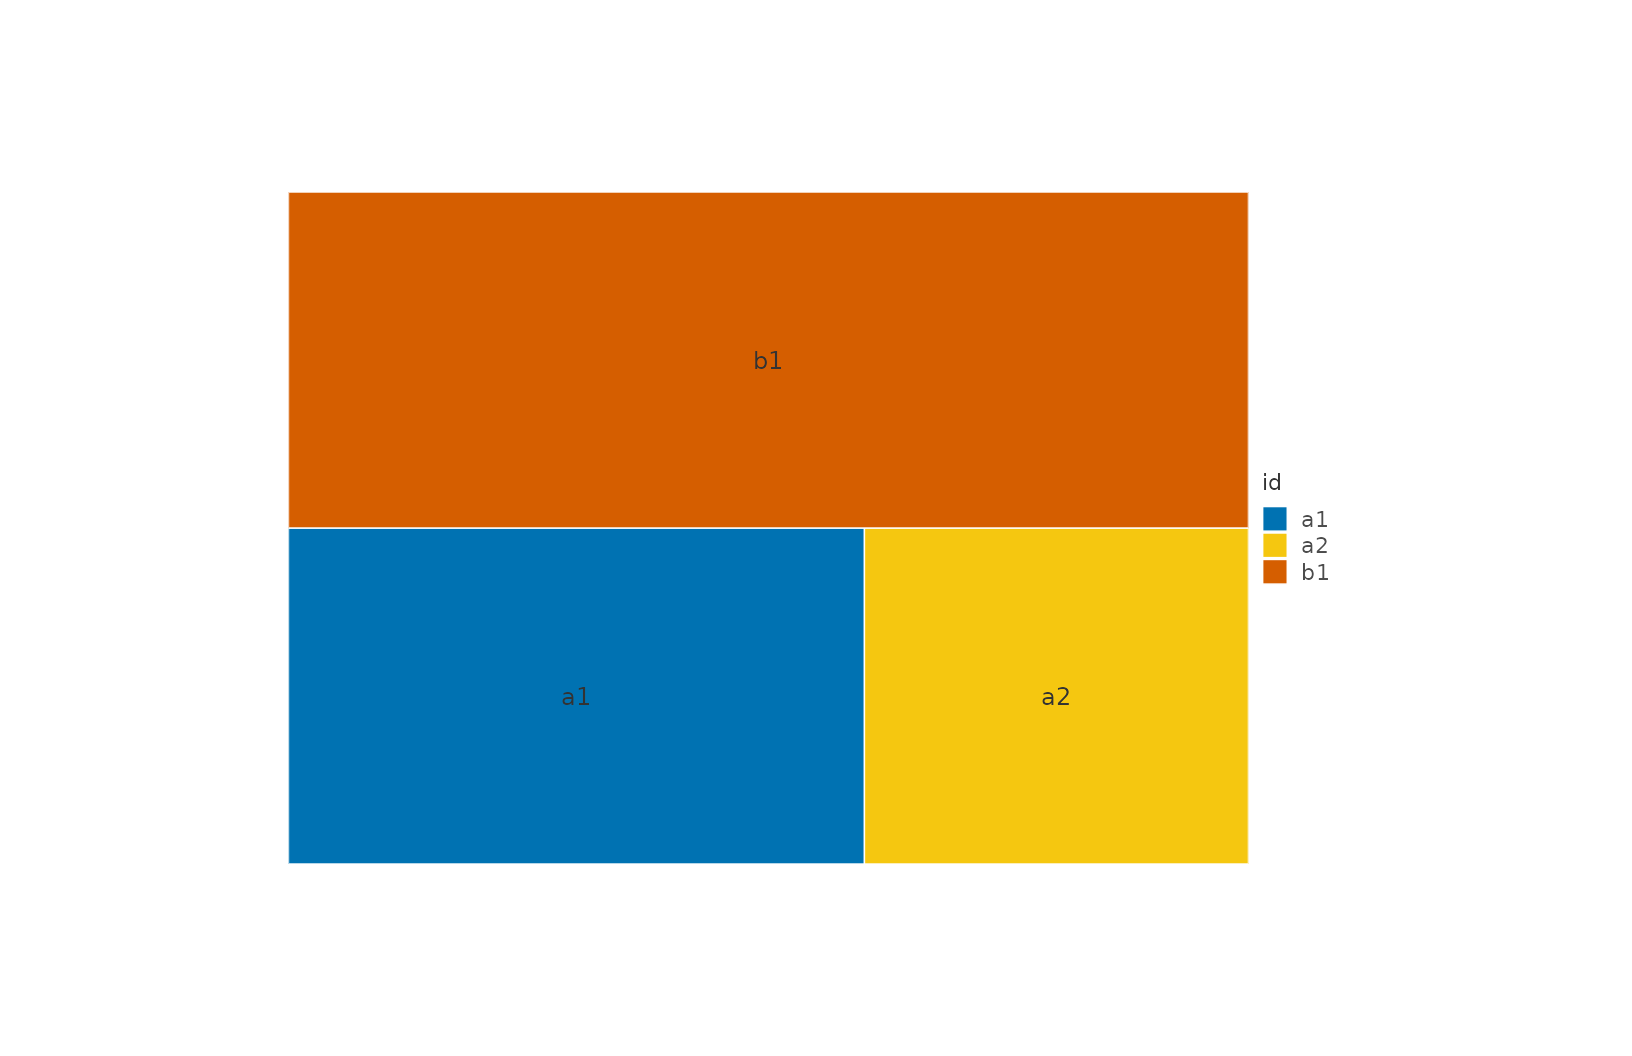
Creates a treemap from a hierarchy table (id/parent columns, leaf
sizes in a value column) using plotit's self-contained squarified
tiling. Equivalent to the pipeline as_graph(hierarchy) |> layout_treemap() |> mark_rect(data = ~leaves); the laid-out tables
(nodes/edges/leaves) are stored on @graph for further tuning.
Arguments
- plot
A plotit object whose data is a hierarchy table with
id,parent, and leaf-levelvaluecolumns (build viaas_graph()on the same shape). A globalencode(fill = ...)maps tile fill against any hierarchy column.- data
Optional hierarchy table for this layer.
- node_color
Default tile fill when no fill aesthetic is mapped (default
._MARK_STYLE$primary="#0072B2").- show_labels
If
TRUE(default), draw leaf ids at tile centres. Labels render white over the unmapped brand-blue fill; when a fill is mapped they fall back to near-black – chainmark_text(data = ~leaves, colour = ...)for full control.- ...
Unused; tiling fine-tuning lives on
layout_treemap()in the explicit pipeline form.
Details
Fully self-contained: no treemapify dependency, deterministic
Bruls squarify layout. Tiles receive the unified white hairline
separators and coordinate axes are blanked (the diagram is
coordinate-free). A mapped fill column ships with the curated token
palette – friendly qualitative for categories, viridis sequential for
continuous values (chain scale_fill() to replace it).
References
AntV G2: Treemap (graphlib)