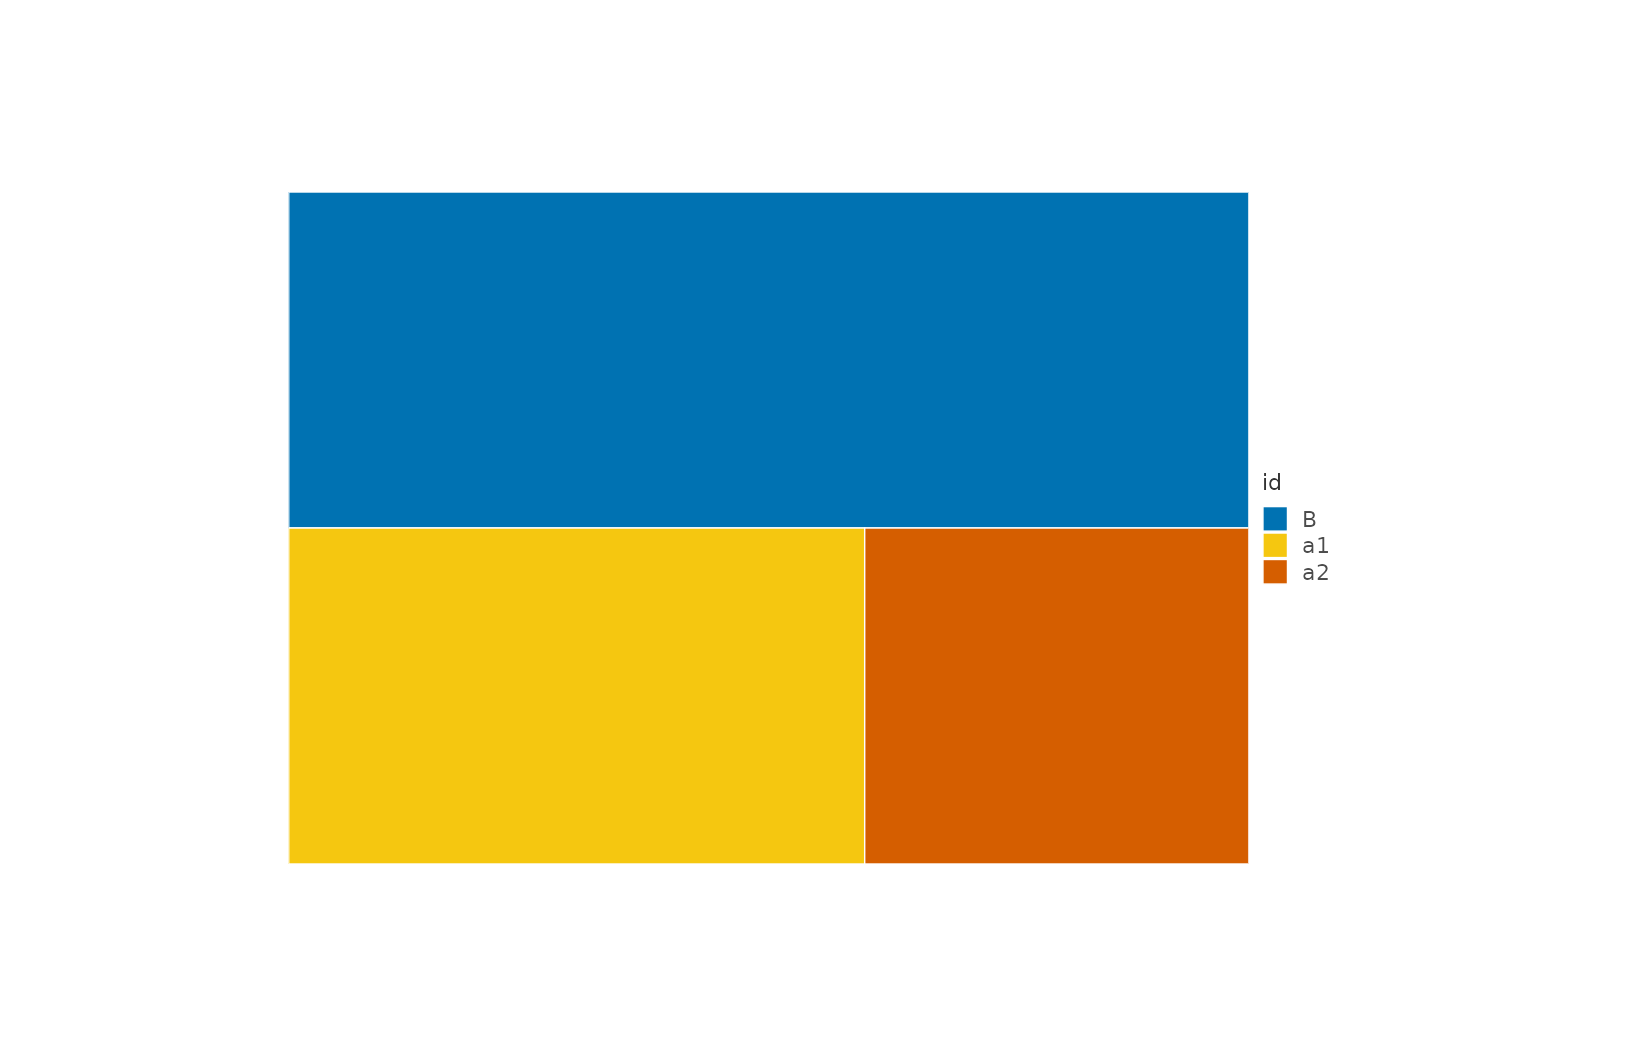
Recursive squarified tiling (Bruls et al.) of a value hierarchy. Leaves
carry sizes in the node table's value column (build via
as_graph() on an id/parent/value hierarchy table); parent values
are aggregated from their descendants. Every node gains
xmin/xmax/ymin/ymax within the unit square plus a leaf flag.
A derived leaves table is emitted for direct rendering with
mark_rect(data = ~leaves).
Value
A modified plotit object (pipeline form), or a new
plotit_graph when called on raw graph data.
Examples
h <- data.frame(
  id     = c("root", "A", "B", "a1", "a2"),
  parent = c(NA, "root", "root", "A", "A"),
  value  = c(NA, NA, 50, 30, 20)
)
g <- as_graph(h) |> layout_treemap()
subset(g$nodes, leaf)[, c("id", "xmin", "xmax")]
#>   id xmin xmax
#> 3  B  0.0  1.0
#> 4 a1  0.0  0.6
#> 5 a2  0.6  1.0

as_graph(h) |>
  plotit() |>
  layout_treemap() |>
  mark_rect(data = ~leaves, encode(fill = id))