Maps data values to fill colours. Same semantics as scale_color() but for
the fill aesthetic (bars, boxes, polygons, etc.).
Usage
scale_fill(
  plot,
  name = ggplot2::waiver(),
  trans = NULL,
  limits = NULL,
  range = NULL,
  breaks = NULL,
  labels = NULL,
  na_color = NULL,
  n_bins = NULL,
  mid = NULL,
  ...
)
Arguments
- plot
A plotit object.
- name
Scale title (legend name).
ggplot2::waiver()= use variable name.- trans
Scale transformation.
NULLauto-detects, otherwise one of:"identity","discrete","reverse","binned". Unsupported values (e.g."log") produce a targeted error message.- limits
Data domain.
- range
Output range. Same as
scale_color(): colour vector, or"viridis","brewer","grey","friendly","hue".- breaks
Legend key positions.
- labels
Legend key labels.
- na_color, n_bins, mid
Same as
scale_color().- ...
Passed to the underlying ggplot2 scale function.
Examples
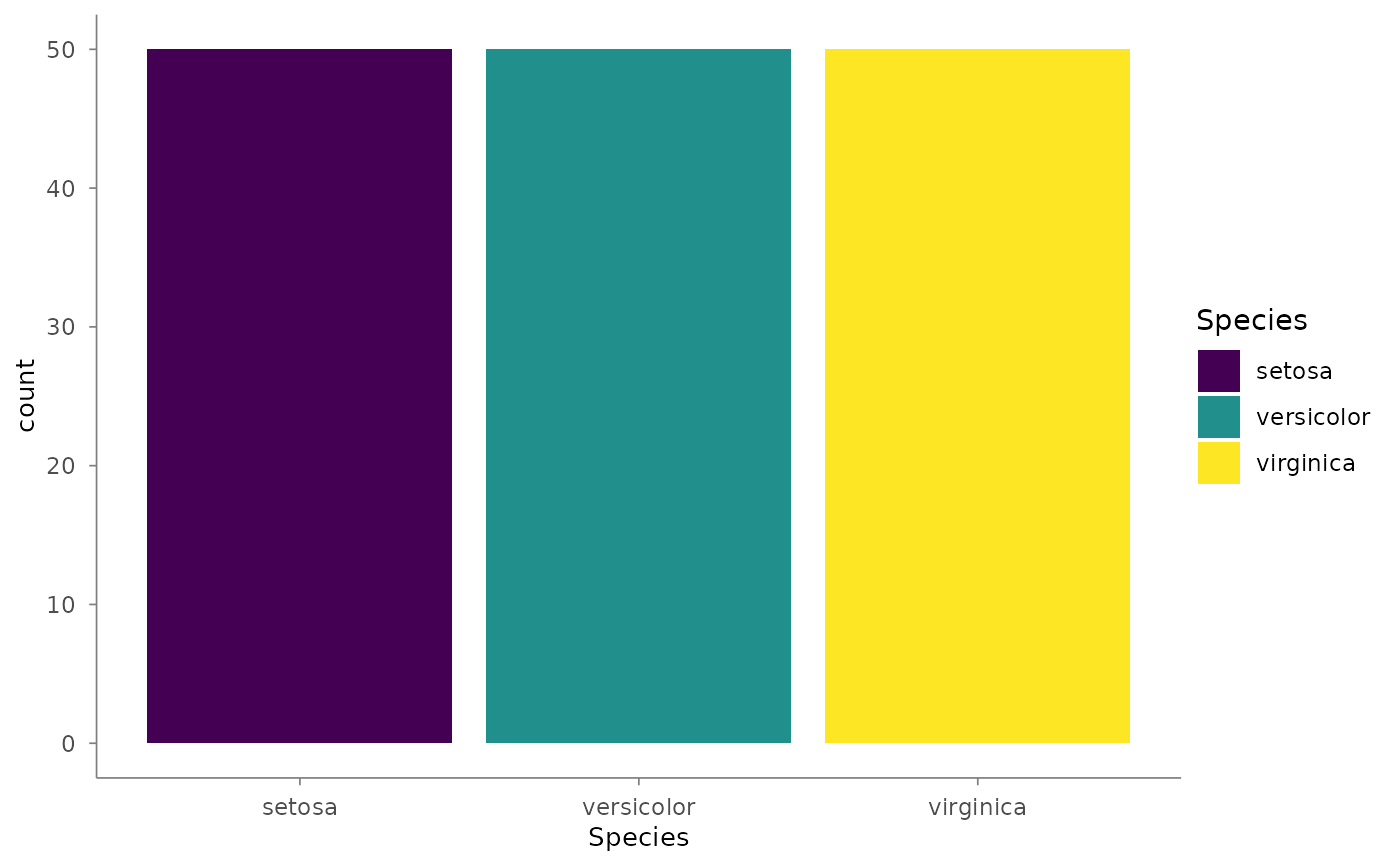
plotit(iris, encode(x = Species, fill = Species)) |>
  mark_bar() |>
  scale_fill(range = "viridis")
#> Warning: `range` = "viridis" with a discrete "fill" variable uses the discrete "viridis"
#> variant.
#> ℹ For a continuous gradient, map a numeric column instead.
#> Scale for fill is already present.
#> Adding another scale for fill, which will replace the existing scale.