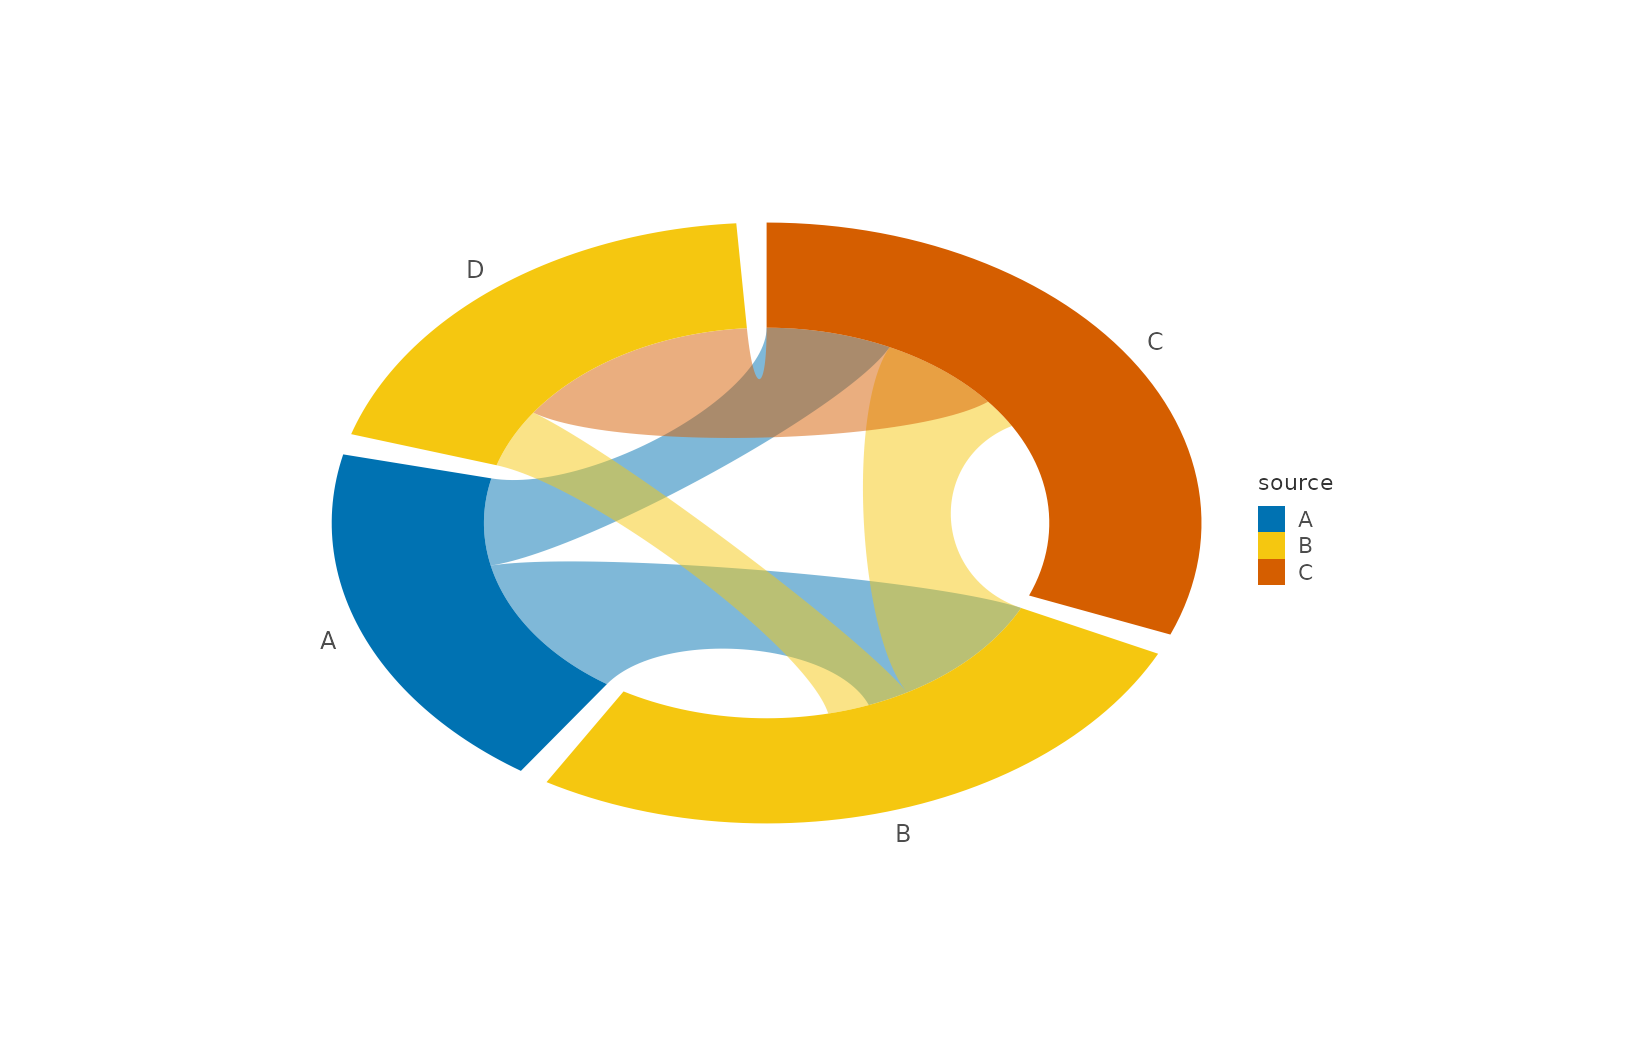
Creates a chord diagram showing pairwise relationships between groups.
Equivalent to the pipeline as_graph() |> layout_chord() |> mark_polygon(data = ~ribbons) |> mark_polygon(data = ~arcs) – see
<U+00A7>3.3.4a. Accepts an edges table with source, target, and
optionally value columns (either mapped via structural aesthetics or
present as literal columns); sector arcs and bezier bands come from the
built-in circular layout (deterministic, dependency-free). The fill
channel defaults to source identity (the same derived-channel rule as
mark_sankey()) and ships with the curated token palette – friendly
qualitative for categories, viridis sequential for continuous values
(chain scale_fill() to replace it).
Usage
mark_chord(
  plot,
  mapping = NULL,
  data = NULL,
  gap_width = 4,
  edge_alpha = ._MARK_STYLE$alpha_link,
  show_labels = TRUE,
  ...
)
Arguments
- plot
A plotit object
- mapping
Structural aesthetics:
source(required),target(required),value(optional). Visual:fillcolours sectors and bands alike; bands default to source identity, compatible withscale_fill_*.- data
Optional edges data.frame for this layer. Other formats (adjacency matrices, contingency tables) convert via
as_graph()first – itsedgestable plugs straight into this mark.- gap_width
Gap between sectors in degrees (default 4); translated to the layout's angular padding.
- edge_alpha
Alpha transparency for link bands (default
._MARK_STYLE$alpha_link= 0.5).- show_labels
If
TRUE(default), draw sector ids outside the ring.- ...
Unused; fine-tuning (inner radius, curvature, sector order) lives on
layout_chord()in the explicit pipeline form.
Details
The laid-out graph (nodes / edges / arcs / ribbons tables) is
stored on @graph, so subsequent marks can reference any table directly
for tuning beyond this sugar's parameters. Sector ids are labelled just
outside the ring and the panel keeps a fixed aspect ratio so sectors
stay circular.
References
AntV G2: Chord (graphlib)