Escape hatch for advanced ggplot2 usage: p + ggplot2::annotate(...),
p + ggplot2::guides(...), p + ggplot2::labs(...) etc. modify the
underlying ggplot and return the plotit object so the pipeline
continues. Prefer the verb API (mark_*, scale_*, label_*,
style) for reproducible, well-validated plots.
Examples
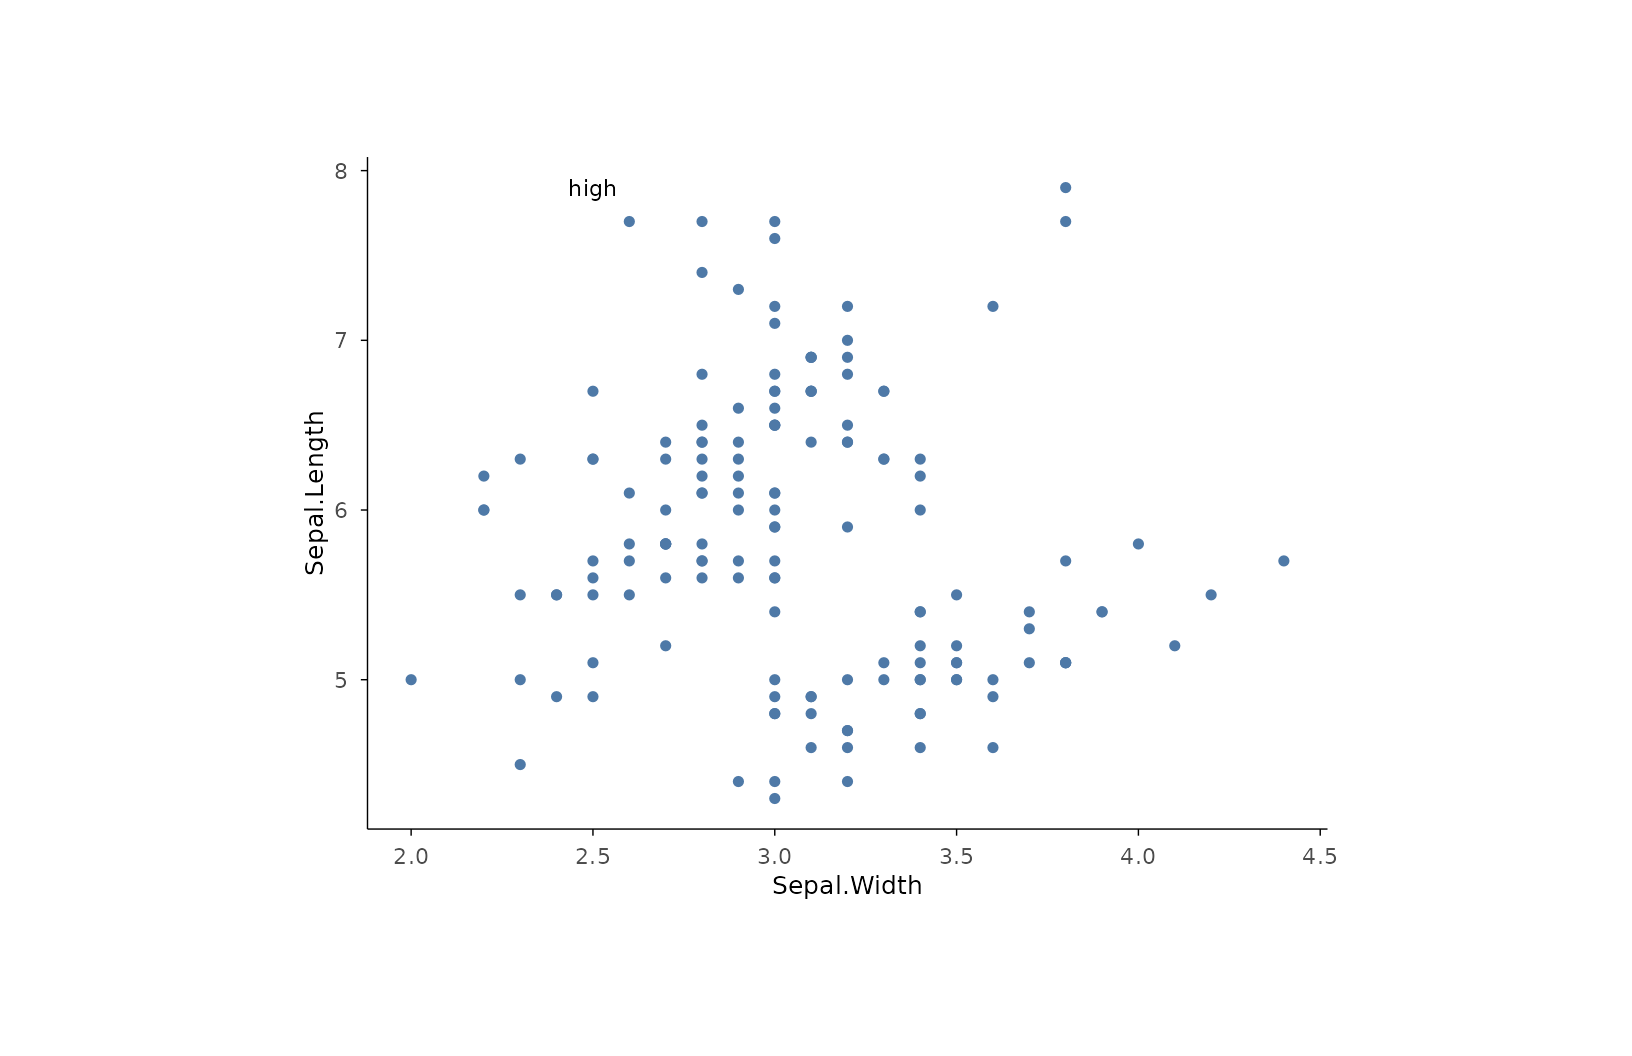
plotit(iris, encode(x = Sepal.Width, y = Sepal.Length)) |>
  mark_point() +
  ggplot2::annotate("text", x = 2.5, y = 7.9, label = "high", size = 3)