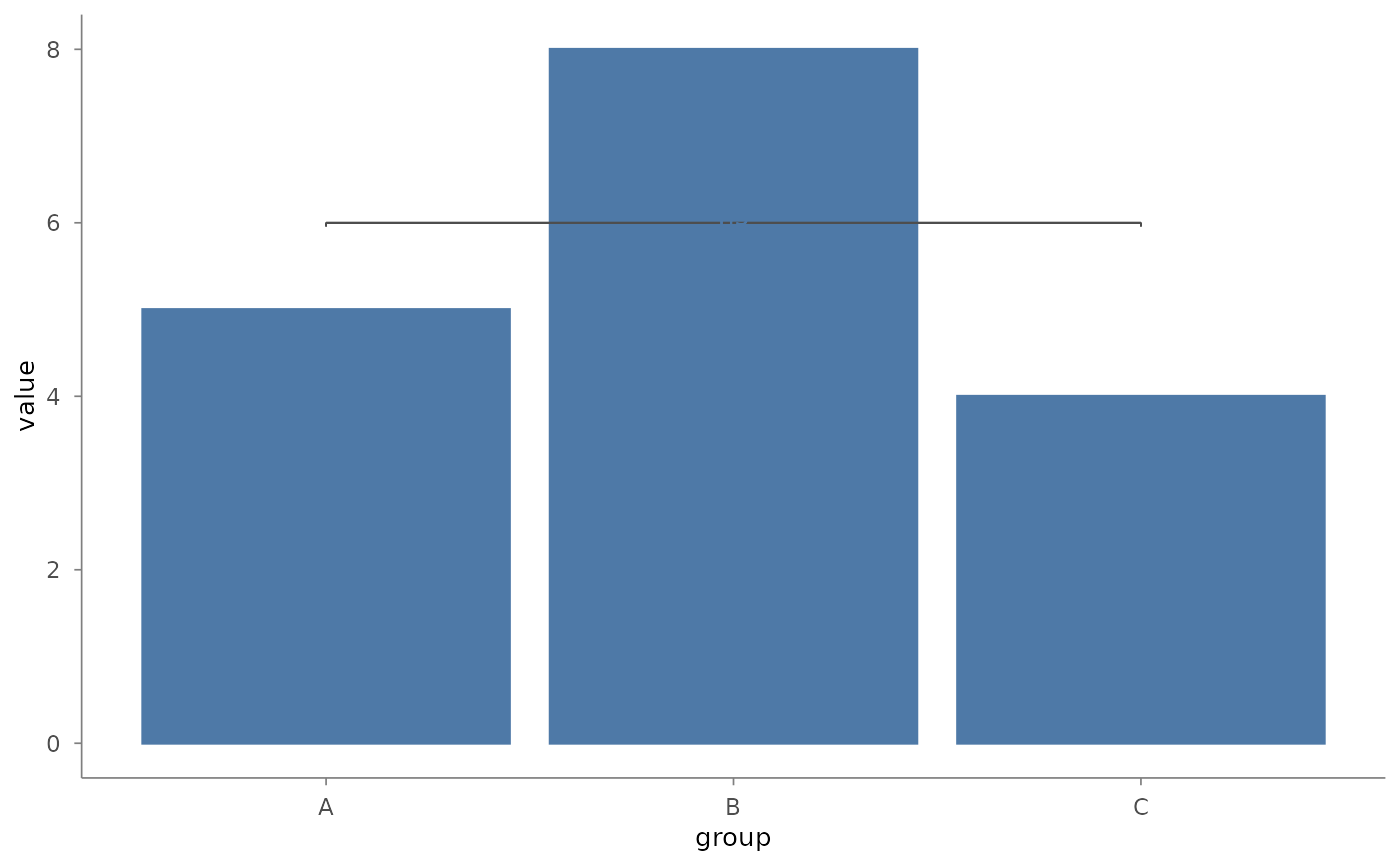
Adds statistical significance brackets and labels between groups.
This is a syntax-sugar composite mark that combines
mark_rule and mark_text internally.
Usage
mark_significance(
  plot,
  comparisons,
  y_position = NULL,
  y_offset = NULL,
  line_color = ._MARK_STYLE$ink,
  line_width = ._MARK_STYLE$lw_thin,
  text_size = ._MARK_STYLE$txt_note,
  tip_length = 0.02,
  ...
)
Arguments
- plot
A plotit object
- comparisons
A data frame with columns:
group1,group2,label, and optionallyy_position. Character columns are matched against the x-axis variable.- y_position
Numeric vector of y-positions for the brackets. If omitted, auto-computed from data range.
- y_offset
Text offset above the bracket line (default 0.5). In data units.
- line_color
Colour for the bracket lines (default
._MARK_STYLE$ink="grey30").- line_width
Width of bracket lines (default 0.5).
- text_size
Size of significance label text (default 3.2).
- tip_length
Length of bracket end-tick lines (default 0.02). Units follow the axis type: a fraction of the level count on discrete x axes, a fraction of the bracket's numeric span on continuous axes.
- ...
Additional arguments passed to the label annotation (
ggplot2::annotate("text", ...)).