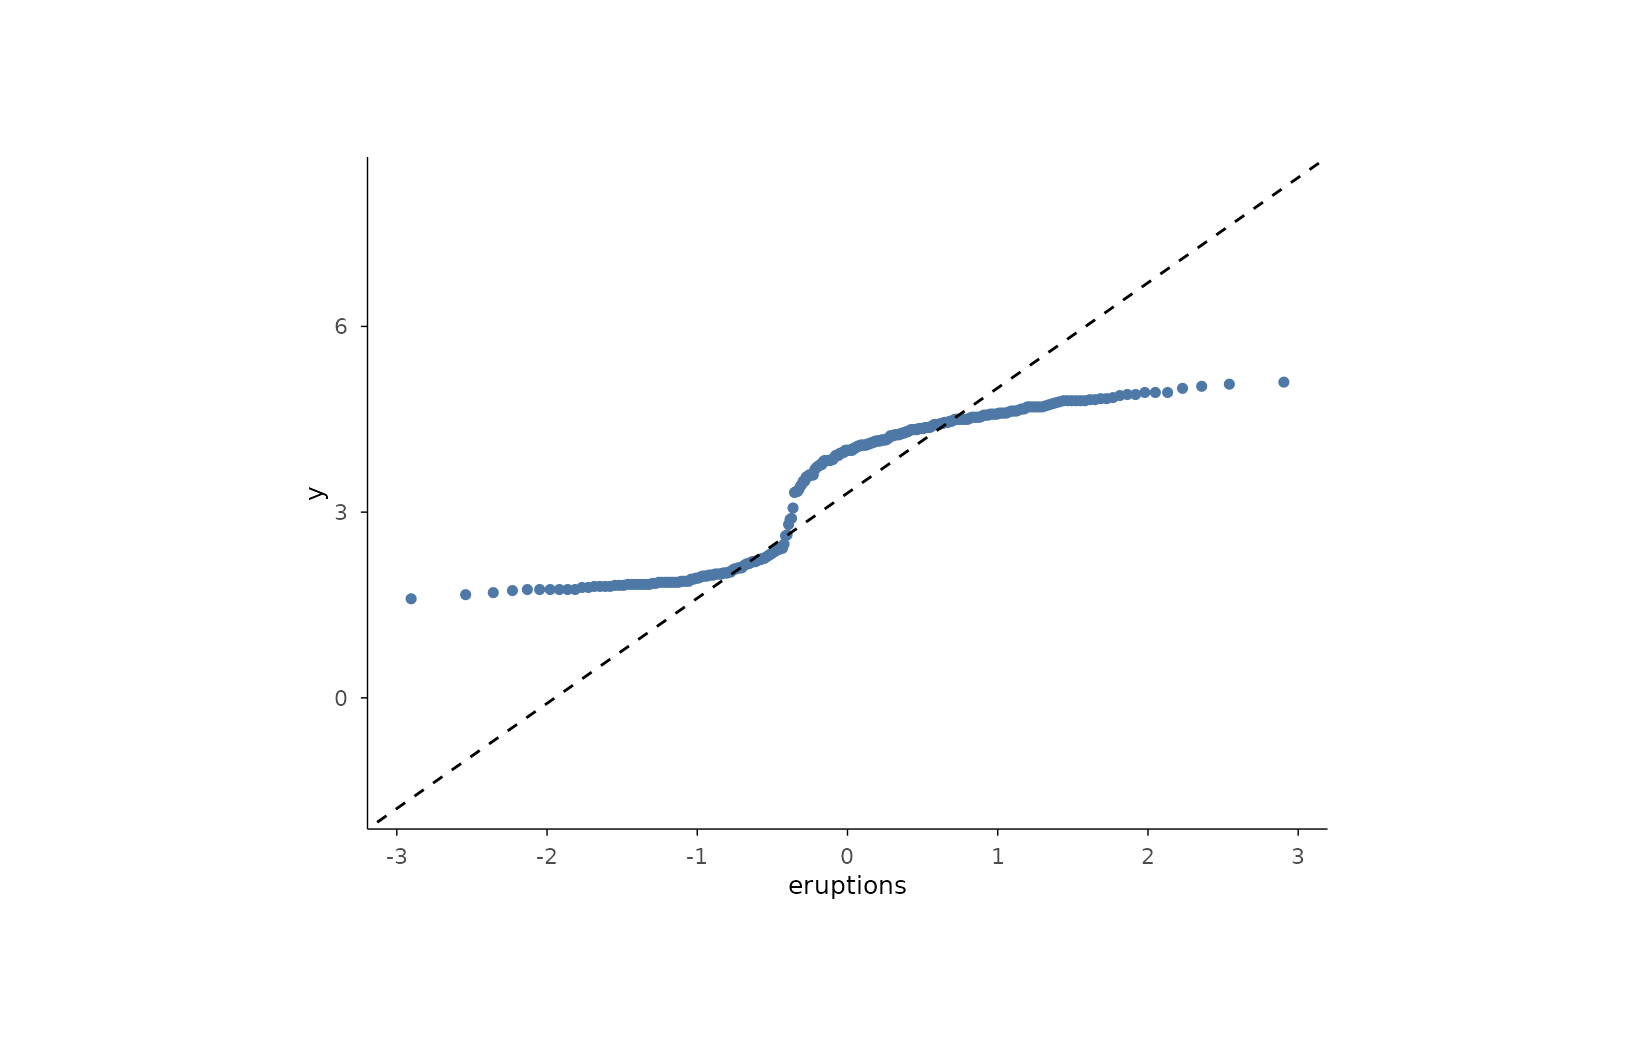
Adds a fitted reference line to a mark_qq() layer: quantiles of the
data projected onto the theoretical distribution. A two-parameter fit
passes through the first and third quartile pairs.
Usage
mark_qq_line(
  plot,
  mapping = NULL,
  data = NULL,
  position = NULL,
  ...,
  distribution = "norm",
  line.p = c(0.25, 0.75),
  fullrange = FALSE,
  rasterize = FALSE,
  rasterize_dpi = 300,
  rasterize_dev = "cairo"
)
Arguments
- plot
A plotit object
- mapping
Optional new aesthetics (inherit from the QQ layer's data:
xrequired)- data
Optional data for this layer
- position
Position adjustment.
- ...
Other arguments passed to
geom_qq_line- distribution
Theoretical quantile function name without
q(default"norm").- line.p
Quantile pair used for the fit (default
c(0.25, 0.75)).- fullrange
If
TRUE, extend the line across the panel range.- rasterize
If
TRUE, rasterize viaggrastr::rasterise().- rasterize_dpi
DPI for rasterization (default 300).
- rasterize_dev
Graphics device for rasterization (default
"cairo").
References
R: stats::qqline() (quartile-pair reference line)
Examples
ecdf_data <- data.frame(eruptions = faithful$eruptions)
plotit(ecdf_data, encode(x = eruptions)) |>
  mark_qq() |>
  mark_qq_line()