Adds sample quantiles against theoretical (or another sample's)
quantiles – the classic normality check. Map x to the sample; y
is optional (another sample for two-sample QQ). Add a reference line
with mark_qq_line().
Usage
mark_qq(
  plot,
  mapping = NULL,
  data = NULL,
  position = NULL,
  ...,
  distribution = "norm",
  rasterize = FALSE,
  rasterize_dpi = 300,
  rasterize_dev = "cairo"
)
Arguments
- plot
A plotit object
- mapping
Optional new aesthetics (
xrequired,yoptional)- data
Optional data for this layer
- position
Position adjustment.
- ...
Other arguments passed to
geom_qq(e.g.dparams)- distribution
Theoretical distribution function without the
qprefix ("norm"default); anyq*function works:"norm","unif","exp","lnorm", ...- rasterize
If
TRUE, rasterize viaggrastr::rasterise().- rasterize_dpi
DPI for rasterization (default 300).
- rasterize_dev
Graphics device for rasterization (default
"cairo").
Examples
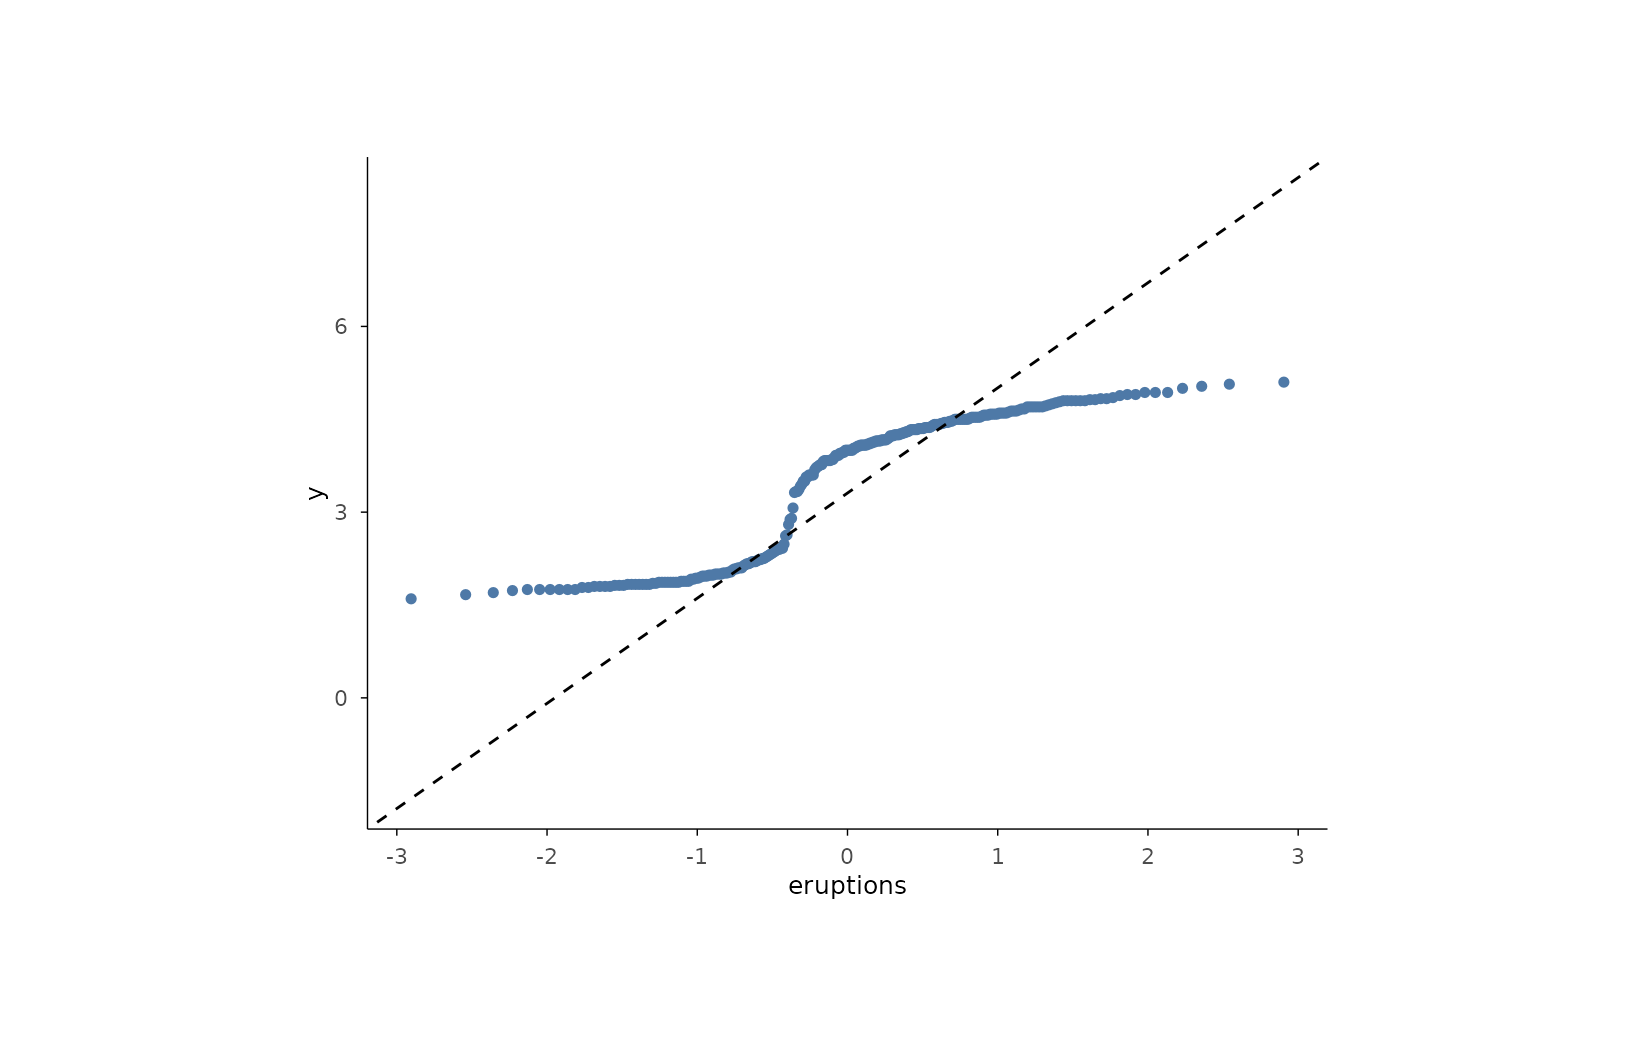
ecdf_data <- data.frame(eruptions = faithful$eruptions)
plotit(ecdf_data, encode(x = eruptions)) |>
mark_qq() |>
mark_qq_line()
 # two-sample QQ against an exponential reference
set.seed(42)
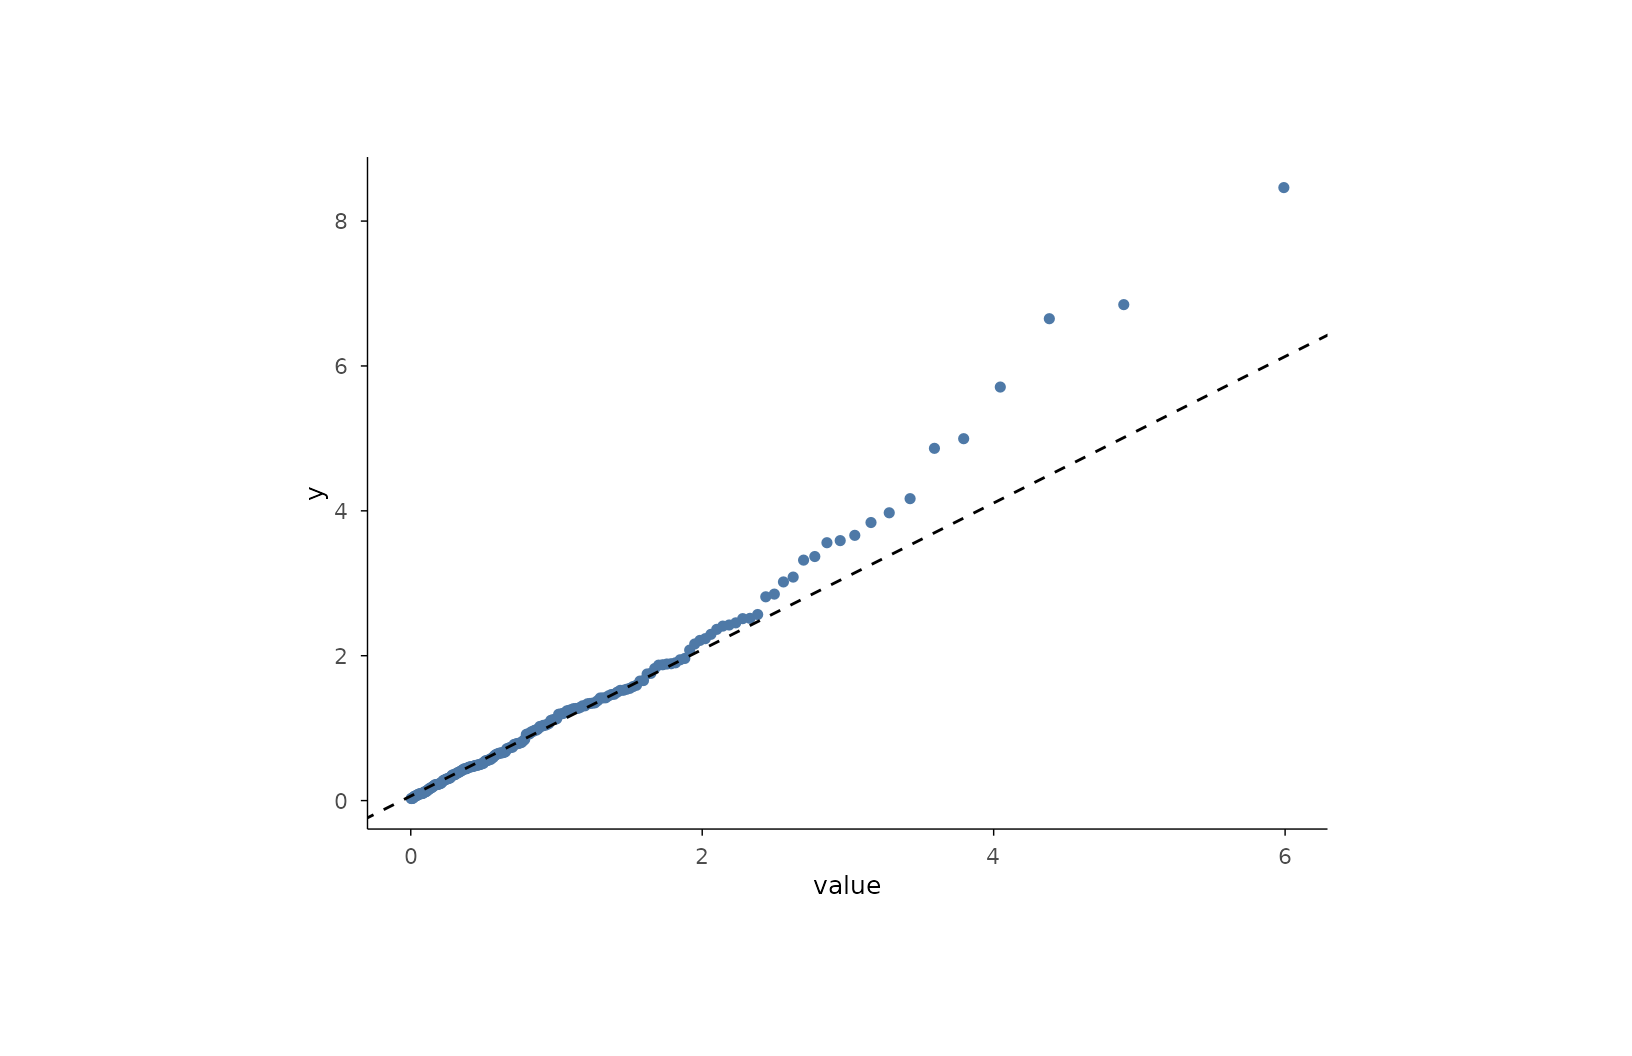
df <- data.frame(value = rexp(200))
plotit(df, encode(x = value)) |>
mark_qq(distribution = "exp") |>
mark_qq_line(distribution = "exp")
# two-sample QQ against an exponential reference
set.seed(42)
df <- data.frame(value = rexp(200))
plotit(df, encode(x = value)) |>
mark_qq(distribution = "exp") |>
mark_qq_line(distribution = "exp")