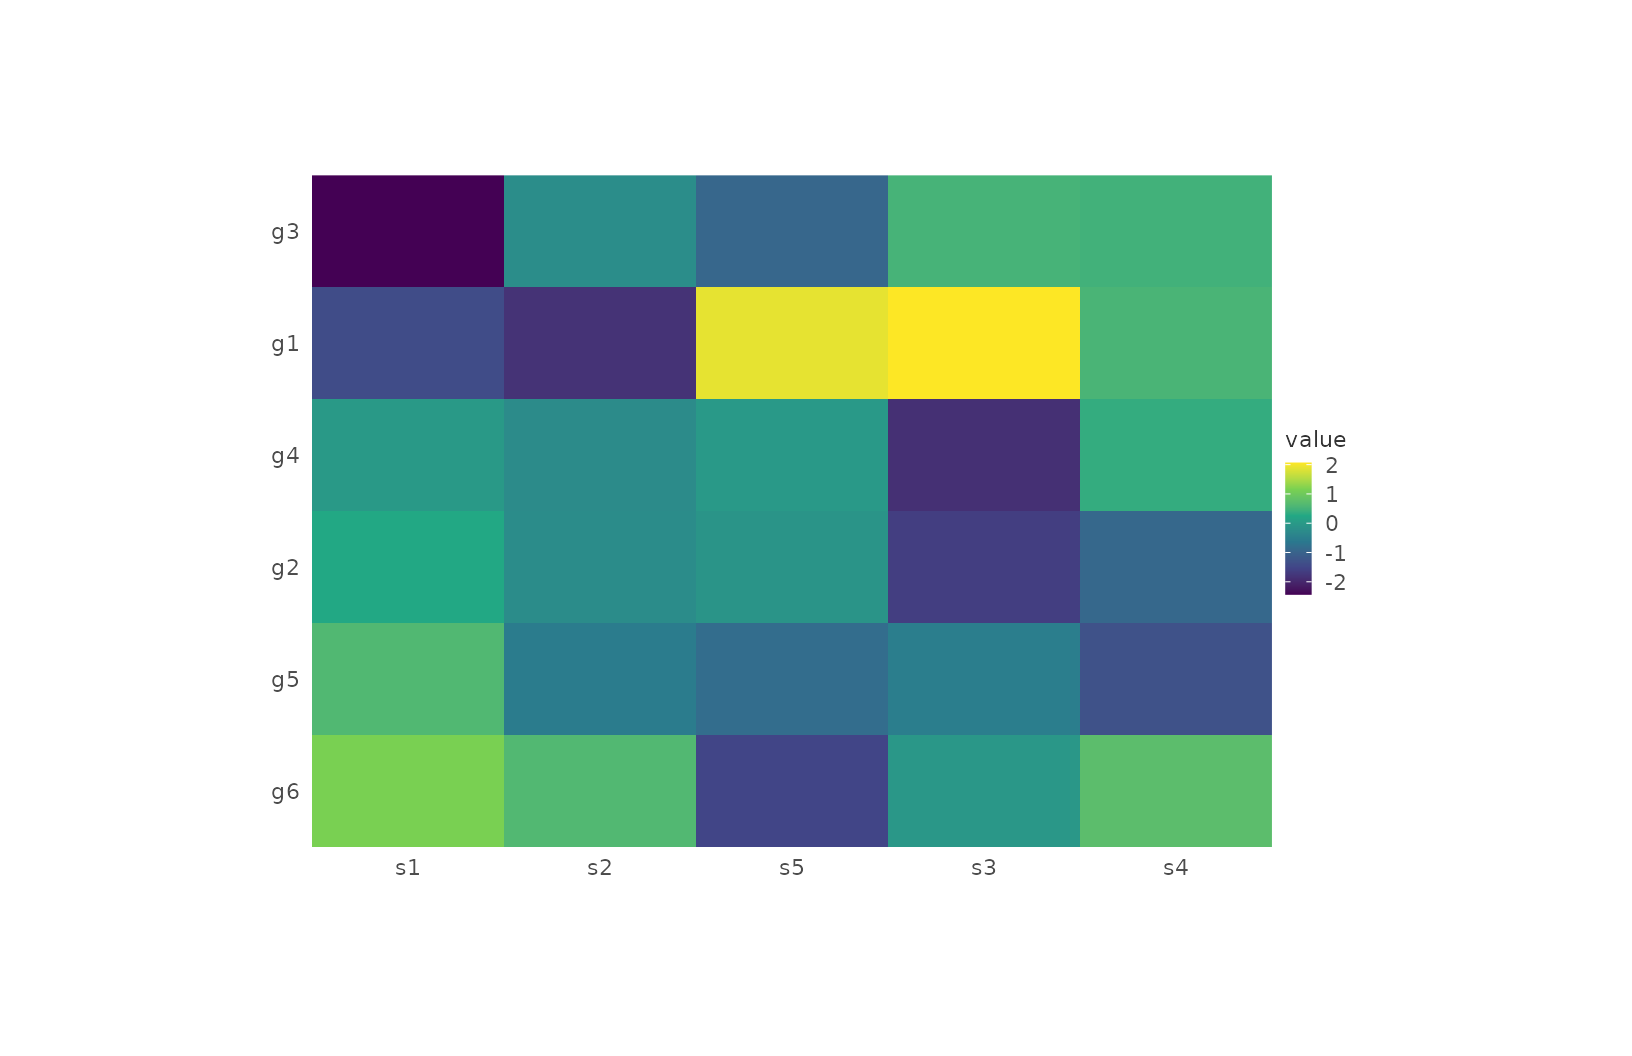
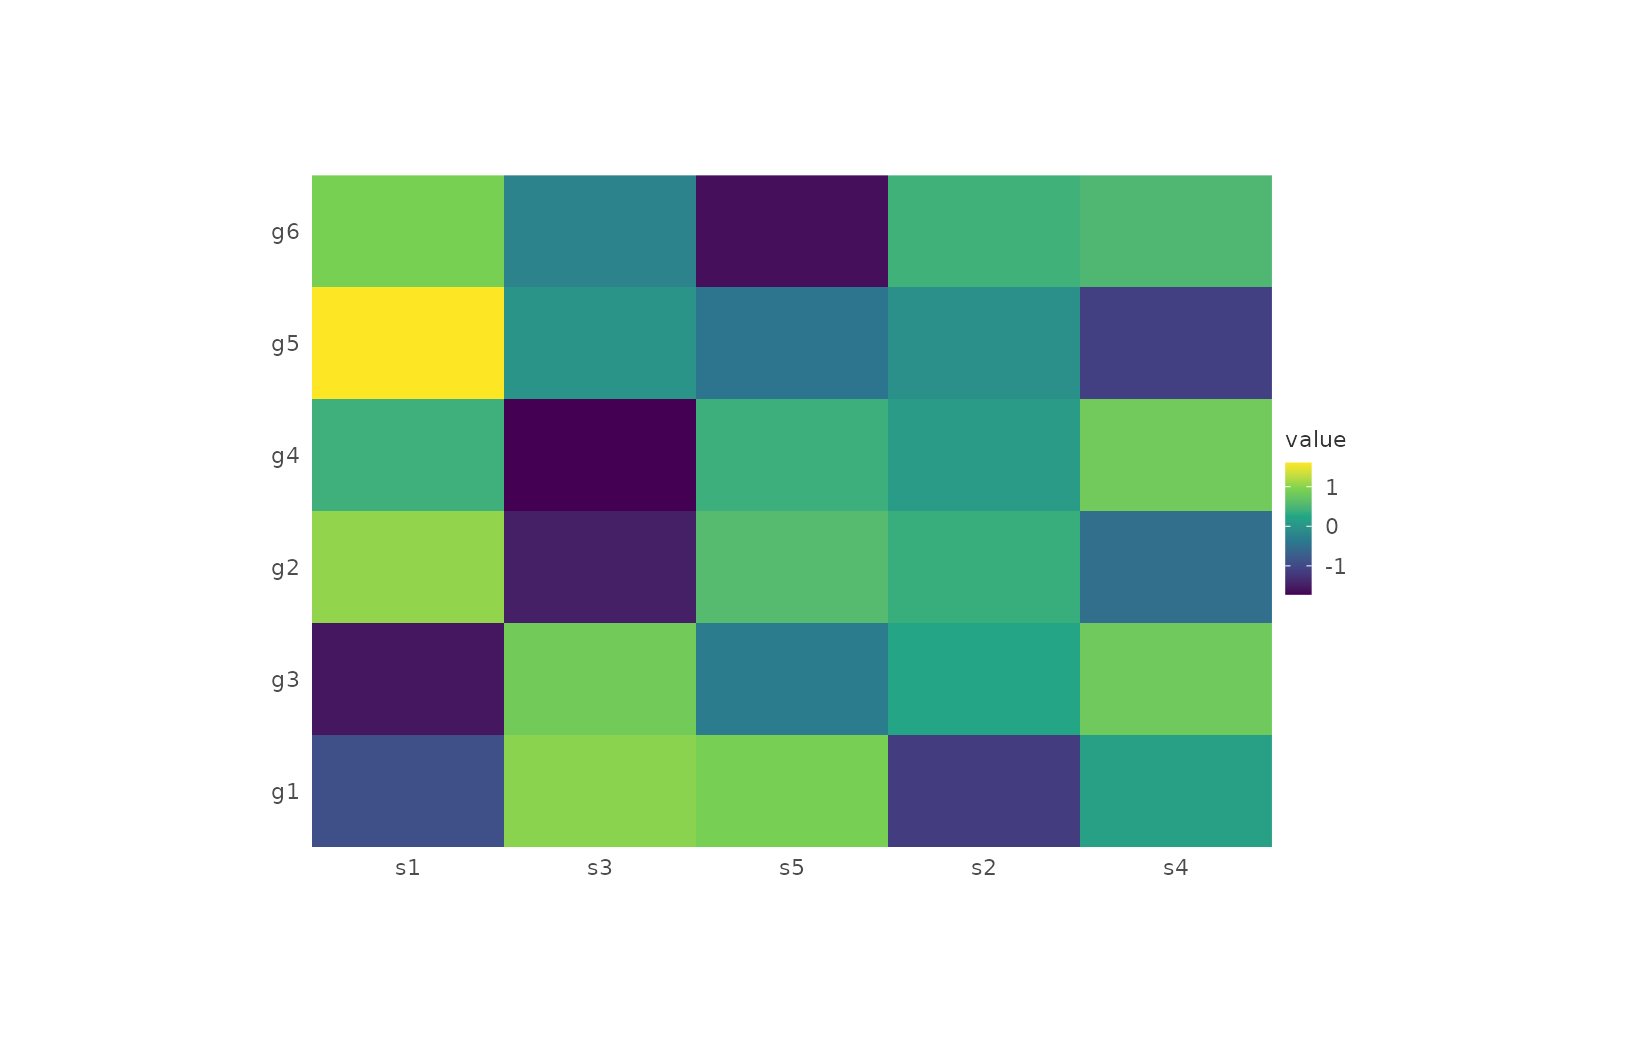
Renders a tidyheatmaps-style matrix heatmap as a plotit mark. Accepts a
numeric matrix, a wide numeric data.frame (columns become heatmap
columns), or a tidy long mapping (encode(x =, y =, fill =)). Optionally
z-score normalises rows/columns (base::scale()) and reorders them by
hierarchical clustering (stats::hclust()). The tile grid reuses the
shared mark path, so it inherits the white-hairline cell chrome (tiles
hug the panel, no 0-origin whitespace) and the colour-blind-safe viridis
fill default; chain scale_fill() to replace it (last call wins). This is
a mark, not a separate system: combine it with layout_dendrogram() and
compose_marginal() for a full annotated heatmap.
Arguments
- plot
A plotit object carrying the matrix / data.frame / tidy mapping.
- cluster
Reorder axes by hierarchical clustering:
"both"(default),"row","column", or"none".- scale
z-score normalisation:
"none"(default),"row", or"column".- show_numbers
Print the value of each cell inside the tile (default
FALSE); implemented as amark_textoverlay.- number_format
Format string for the cell numbers (default
"%.2f").- number_color
Cell number colour;
NULL(default) applies auto-contrast (white on dark cells, ink on light cells).- na_color
Fill colour for
NAcells (default"grey85"; the tidyheatmapscolor_nacounterpart).- range
Fill scale for the cell values: a scheme name (
"viridis"default for sequential data;"rdbu"/"spectral"/"brbg"etc. for diverging data), a colour vector, orNULLfor the default.- ...
Other arguments passed to
ggplot2::geom_tile().- rasterize
If
TRUE, rasterize viaggrastr::rasterise().- rasterize_dpi
DPI for rasterization (default 300).
- rasterize_dev
Graphics device for rasterization (default
"cairo").
References
R: stats::hclust() / stats::dist() (row/column clustering)
tidyheatmaps: Heatmaps from Tidy Data