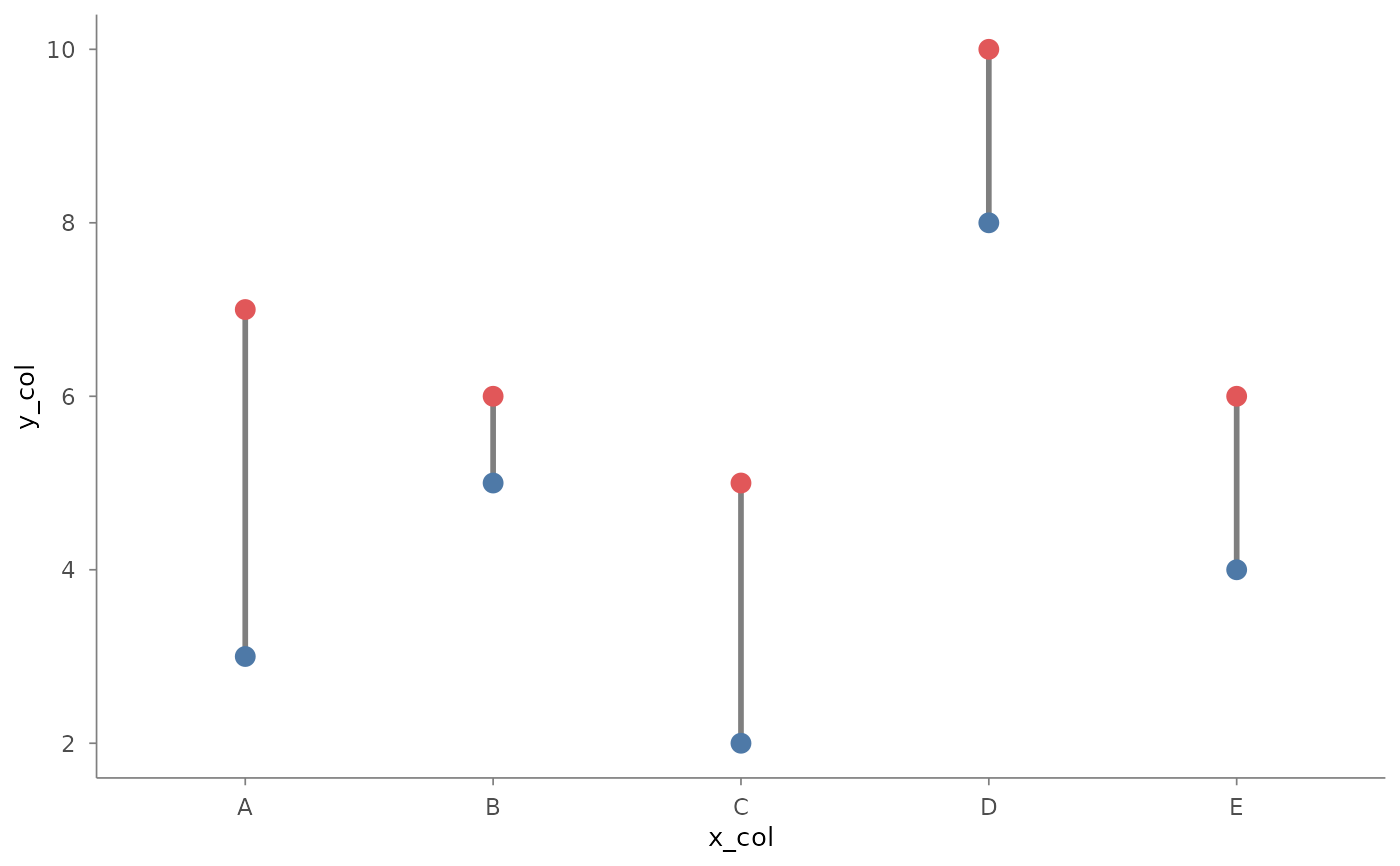
Creates a dumbbell chart with two connected points showing before/after
or paired comparisons. This is a syntax-sugar composite mark
combining two mark_point calls and a geom_segment.
Usage
mark_dumbbell(
  plot,
  mapping = NULL,
  data = NULL,
  color_start = NULL,
  color_end = NULL,
  line_color = NULL,
  point_size = ._MARK_STYLE$point_head,
  line_width = ._MARK_STYLE$lw_thin,
  ...
)
Arguments
- plot
A plotit object
- mapping
Optional new aesthetics
- data
Optional data for this layer
- color_start
Colour for the start point.
NULL(default) uses primary#0072B2when no colour channel is mapped; a livecolouraesthetic colours both endpoints instead.- color_end
Colour for the end point.
NULL(default) uses secondary#E15759when no colour channel is mapped; a livecolouraesthetic colours both endpoints instead.- line_color
Colour for the connecting line.
NULL(default) follows a mapped colour, else soft grey.- point_size
Size for both dumbbell points (default 3).
- line_width
Width for the connecting line (default 0.5, connector rung).
- ...
Other arguments passed to
mark_point()calls
Details
Equivalent expansion:
  p |> mark_rule(x = x, xend = x, y = y_start, yend = y_end) |>
       mark_point(x = x, y = y_start, colour = color_start) |>
       mark_point(x = x, y = y_end, colour = color_end)
References
AntV G2: Link (corelib)
Examples
df <- data.frame(
  cat = LETTERS[1:5], before = c(3, 5, 2, 8, 4),
  after = c(7, 6, 5, 10, 6)
)
plotit(df, encode(x = cat, y = before, yend = after)) |>
  mark_dumbbell()