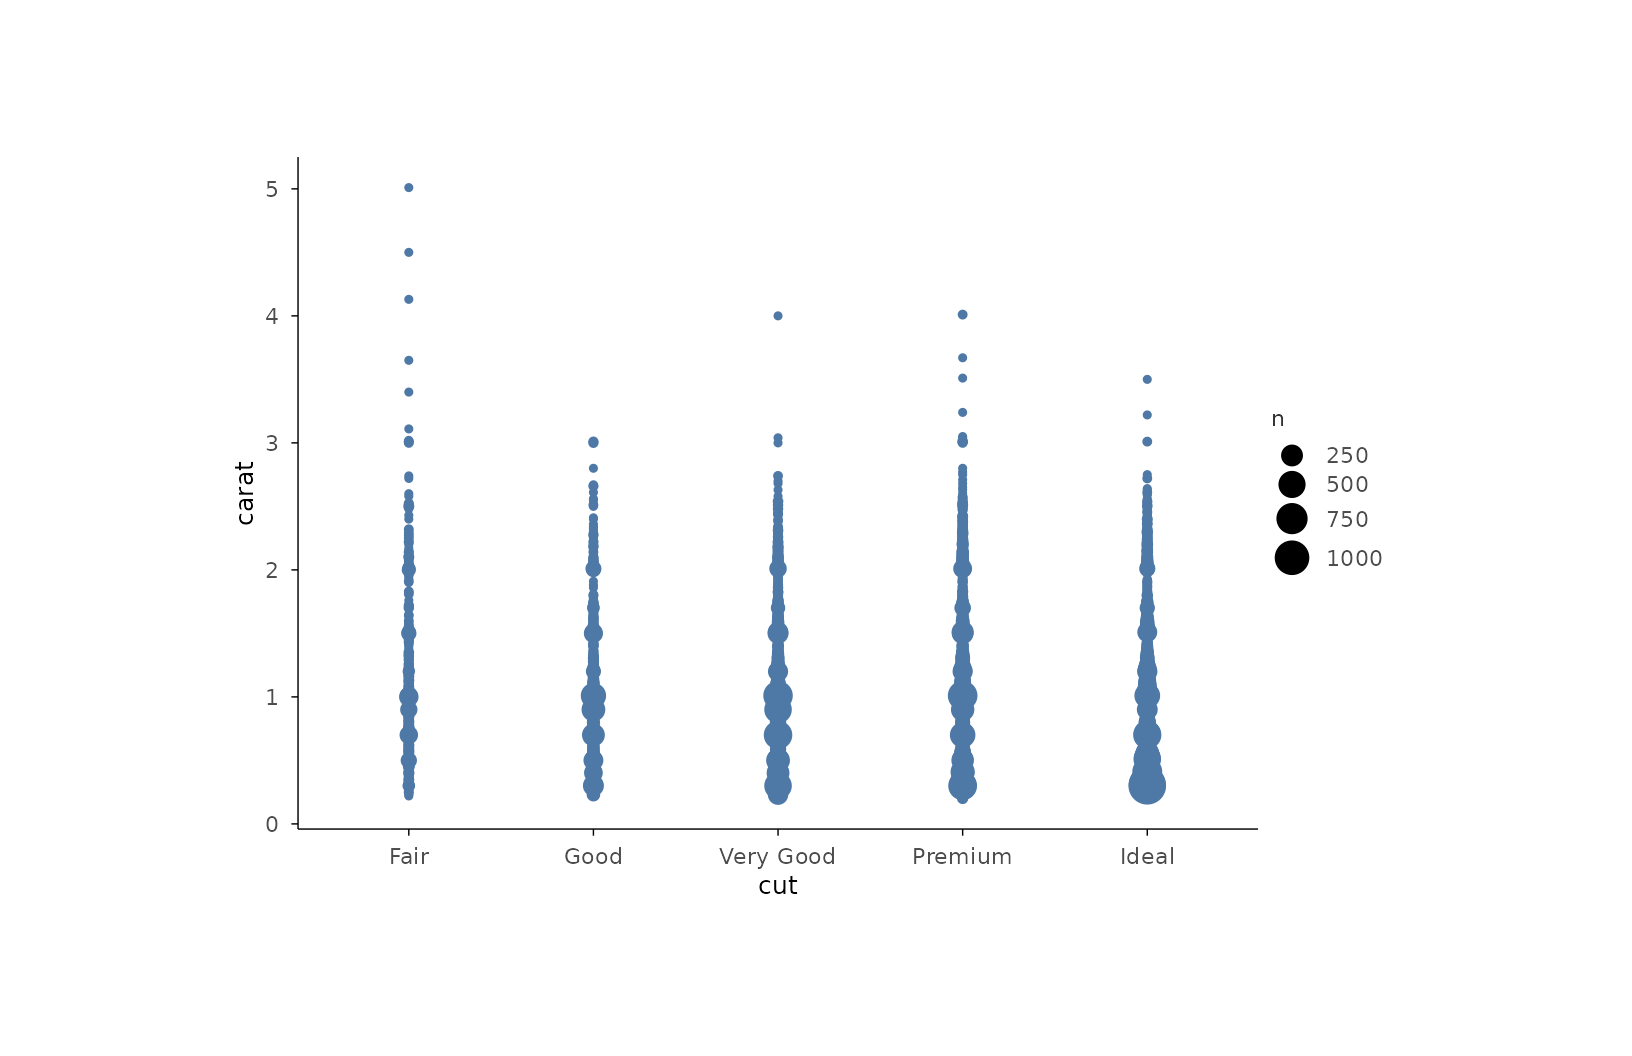
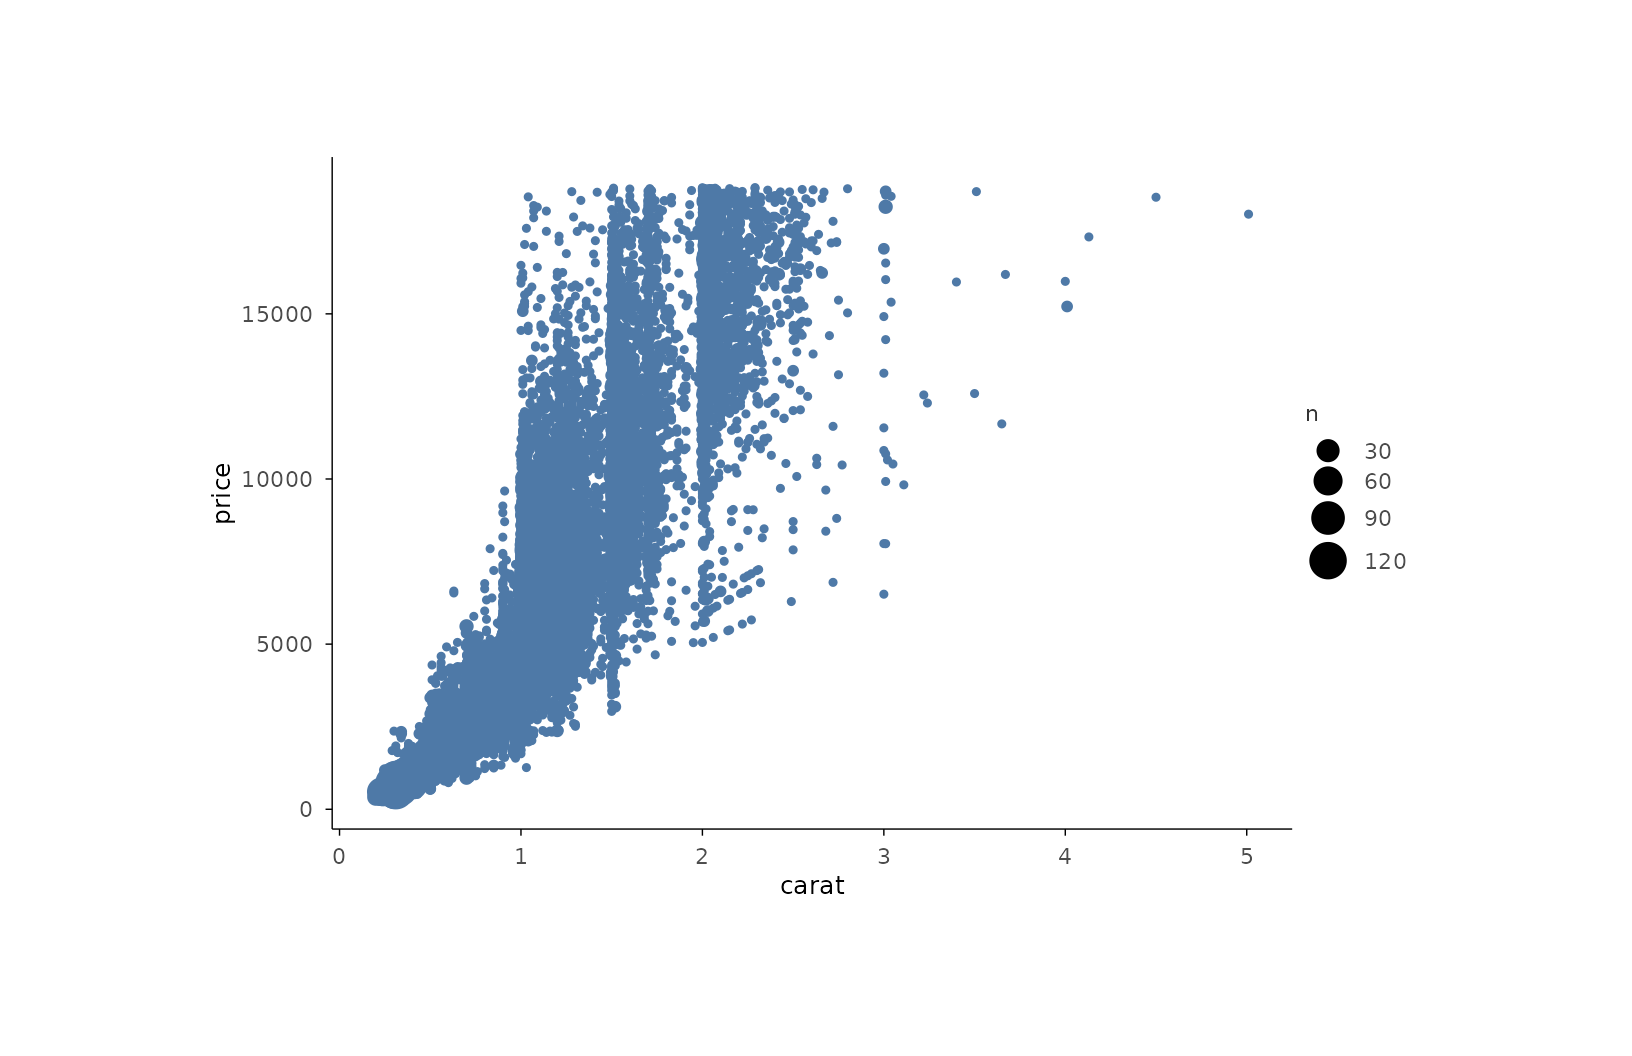
Draws each unique point once, sized by the number of observations at
that location (stat_sum). The standard answer to overplotting in
scatter plots of discrete or binned data; pair with scale_size()
for an area-proportional legend.
Usage
mark_count(
  plot,
  mapping = NULL,
  data = NULL,
  position = NULL,
  ...,
  rasterize = FALSE,
  rasterize_dpi = 300,
  rasterize_dev = "cairo"
)
Arguments
- plot
A plotit object
- mapping
Optional new aesthetics
- data
Optional data for this layer
- position
Position adjustment.
- ...
Other arguments passed to
geom_count- rasterize
If
TRUE, rasterize viaggrastr::rasterise().- rasterize_dpi
DPI for rasterization (default 300).
- rasterize_dev
Graphics device for rasterization (default
"cairo").