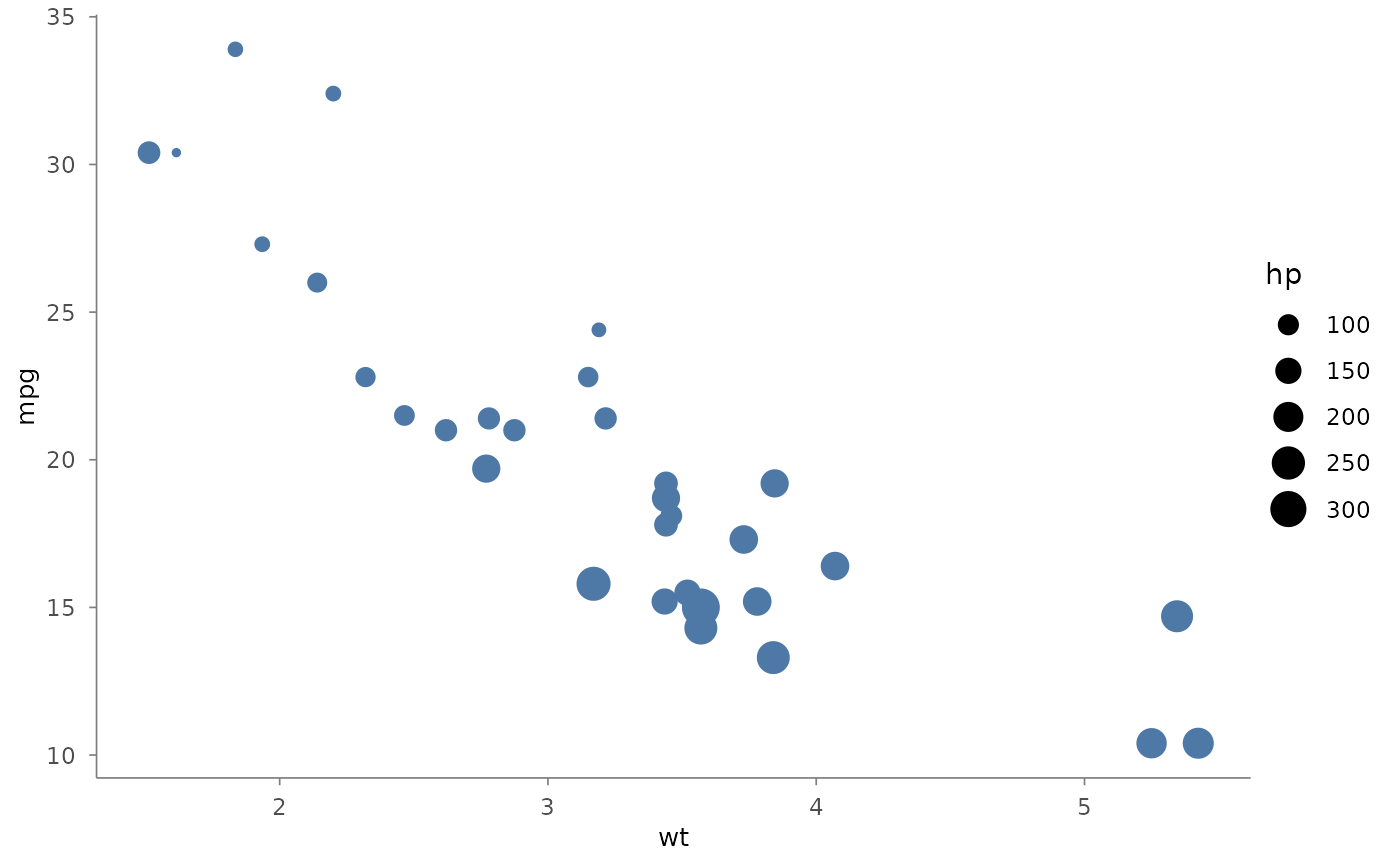
Maps data values to point/line sizes.
Usage
scale_size(
  plot,
  name = ggplot2::waiver(),
  trans = NULL,
  limits = NULL,
  range = NULL,
  breaks = NULL,
  labels = NULL,
  ...
)
Arguments
- plot
A plotit object.
- name
Scale title (legend name).
- trans
Scale transformation.
NULLauto-detects, otherwise one of:"identity","discrete","reverse","binned". Unsupported values (e.g."log") produce a targeted error message.- limits
Data domain.
- range
Output size range as
c(min, max).NULL= defaultc(1, 6). Only meaningful for continuous scales (ignored for discrete/binned).- breaks
Legend key positions.
- labels
Legend key labels.
- ...
Passed to the underlying ggplot2 scale function.
Examples
plotit(mtcars, encode(x = wt, y = mpg, size = hp)) |>
  mark_point() |>
  scale_size(range = c(1, 6))