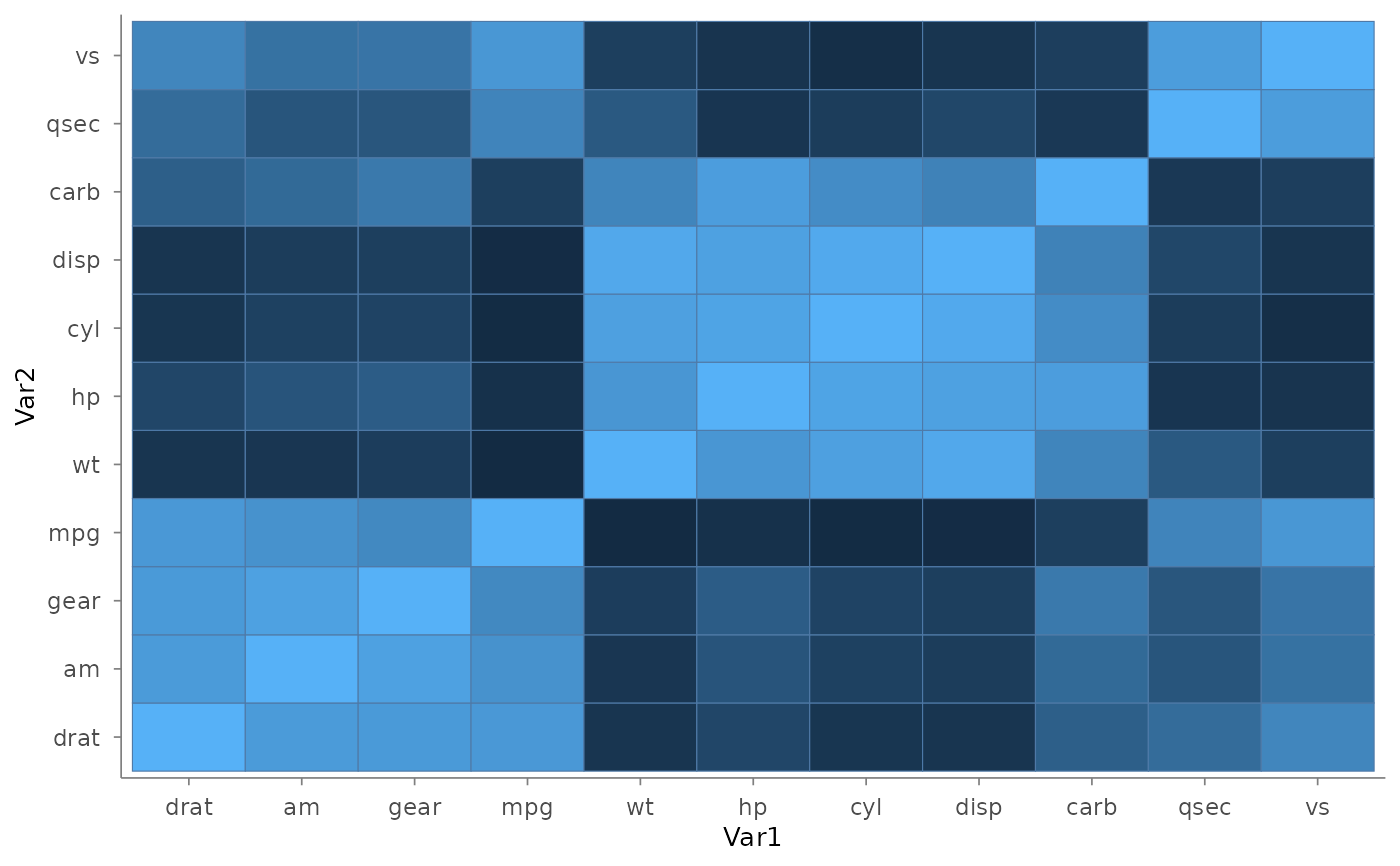
Computes a correlation matrix from numeric data columns, optionally
reorders by hierarchical clustering, and renders it as a tile heatmap.
The value fill scale defaults to viridis (colour-blind safe); chain
scale_fill() afterwards to replace it (last call wins).
Usage
mark_corr(
  plot,
  method = c("pearson", "spearman", "kendall"),
  reorder = TRUE,
  range = NULL,
  ...,
  rasterize = FALSE,
  rasterize_dpi = 300,
  rasterize_dev = "cairo"
)
Arguments
- plot
A plotit object. Numeric columns are extracted from the plot data for correlation computation.
- method
Correlation method:
"pearson"(default),"spearman", or"kendall".- reorder
If
TRUE(default), reorder rows and columns by hierarchical clustering.- range
Fill scale for the correlation values: a diverging scheme name (default
"rdbu"; also"rdylbu","spectral","brbg","puor","blue2brown"), a colour vector, orNULLfor the default.- ...
Other arguments passed to
geom_tile- rasterize
If
TRUE, rasterize viaggrastr::rasterise().- rasterize_dpi
DPI for rasterization (default 300).
- rasterize_dev
Graphics device for rasterization (default
"cairo").
References
R: stats::cor() (pairwise correlation matrix)
AntV G2: Cell (correlation matrix expression)