Divides the x-y plane into rectangular bins and fills each by the count
(or another aggregation) of observations it holds. The rectangular
sibling of mark_hex(): exact bin boundaries make counts easier to read
against the axes, hex bins pack denser.
Usage
mark_bin2d(
  plot,
  mapping = NULL,
  data = NULL,
  position = NULL,
  ...,
  bins = NULL,
  binwidth = NULL,
  rasterize = FALSE,
  rasterize_dpi = 300,
  rasterize_dev = "cairo"
)
Arguments
- plot
A plotit object
- mapping
Optional new aesthetics
- data
Optional data for this layer
- position
Position adjustment.
- ...
Other arguments passed to
geom_bin_2d- bins
Number of bins along each axis (default 30).
- binwidth
Bin width along each axis; overrides
binswhen given.- rasterize
If
TRUE, rasterize viaggrastr::rasterise().- rasterize_dpi
DPI for rasterization (default 300).
- rasterize_dev
Graphics device for rasterization (default
"cairo").
Details
The bin-count fill is owned by this closed statistical mark: it defaults
to the sequential viridis scale (colour-blind safe). Chain
scale_fill() afterwards to replace it (last call wins).
Examples
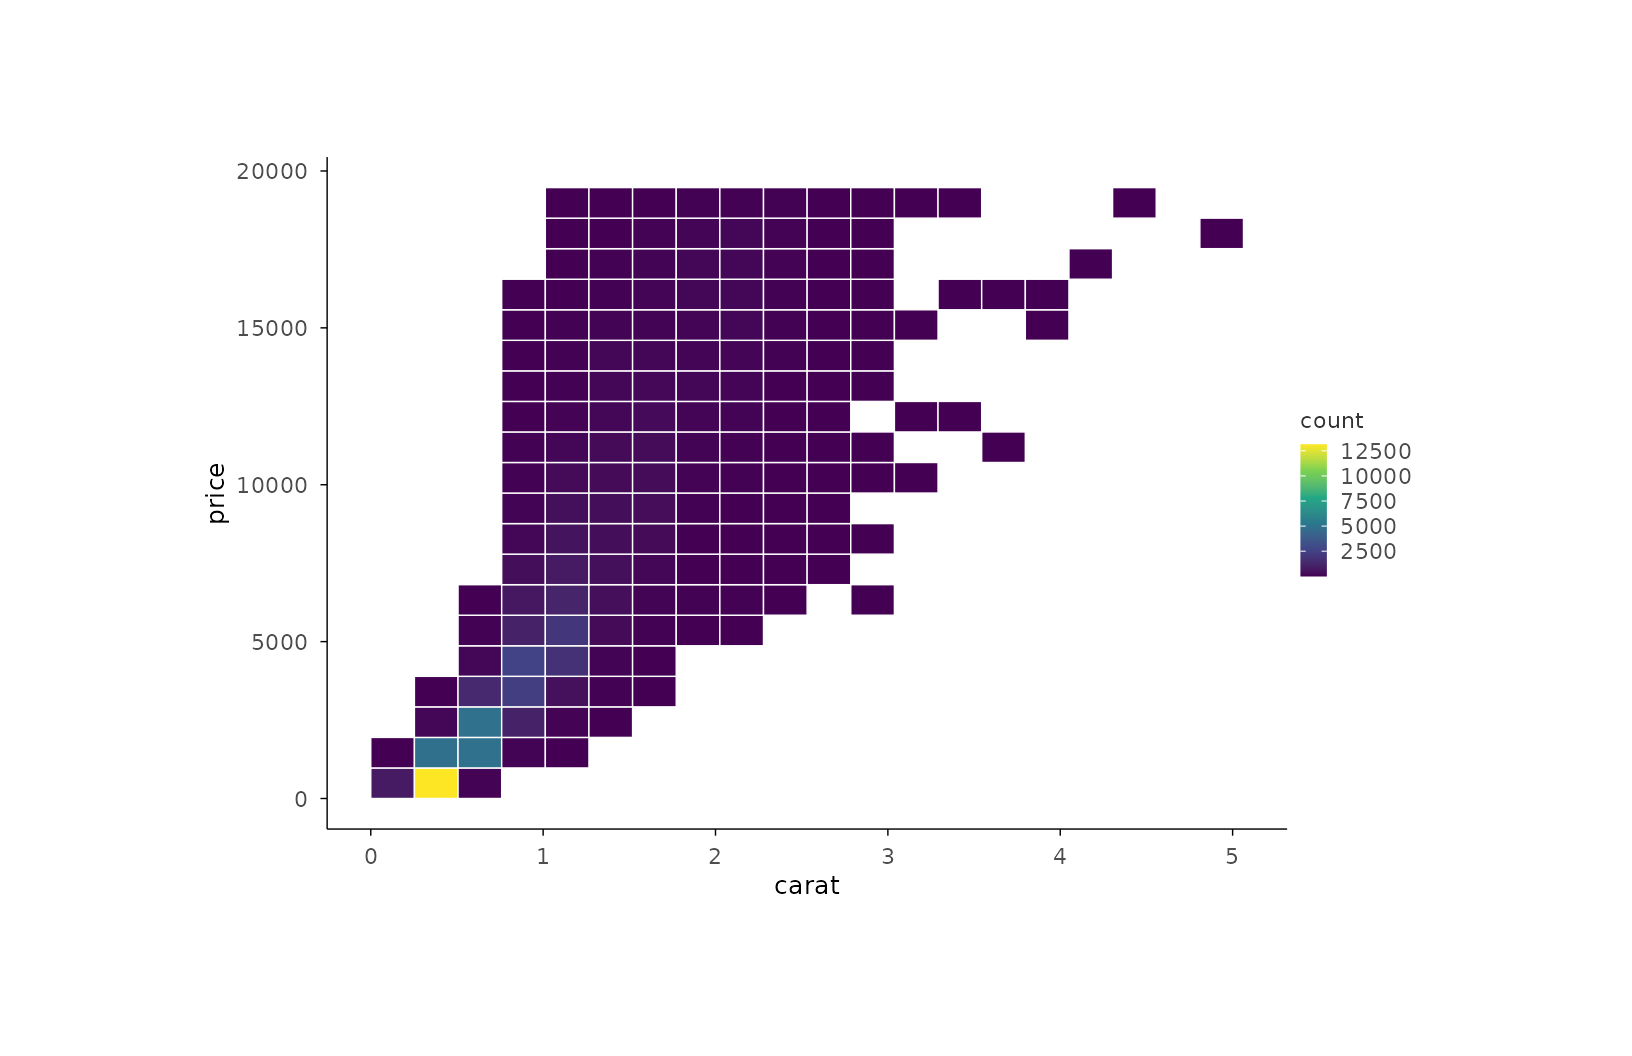
plotit(ggplot2::diamonds, encode(x = carat, y = price)) |>
mark_bin2d(bins = 20)
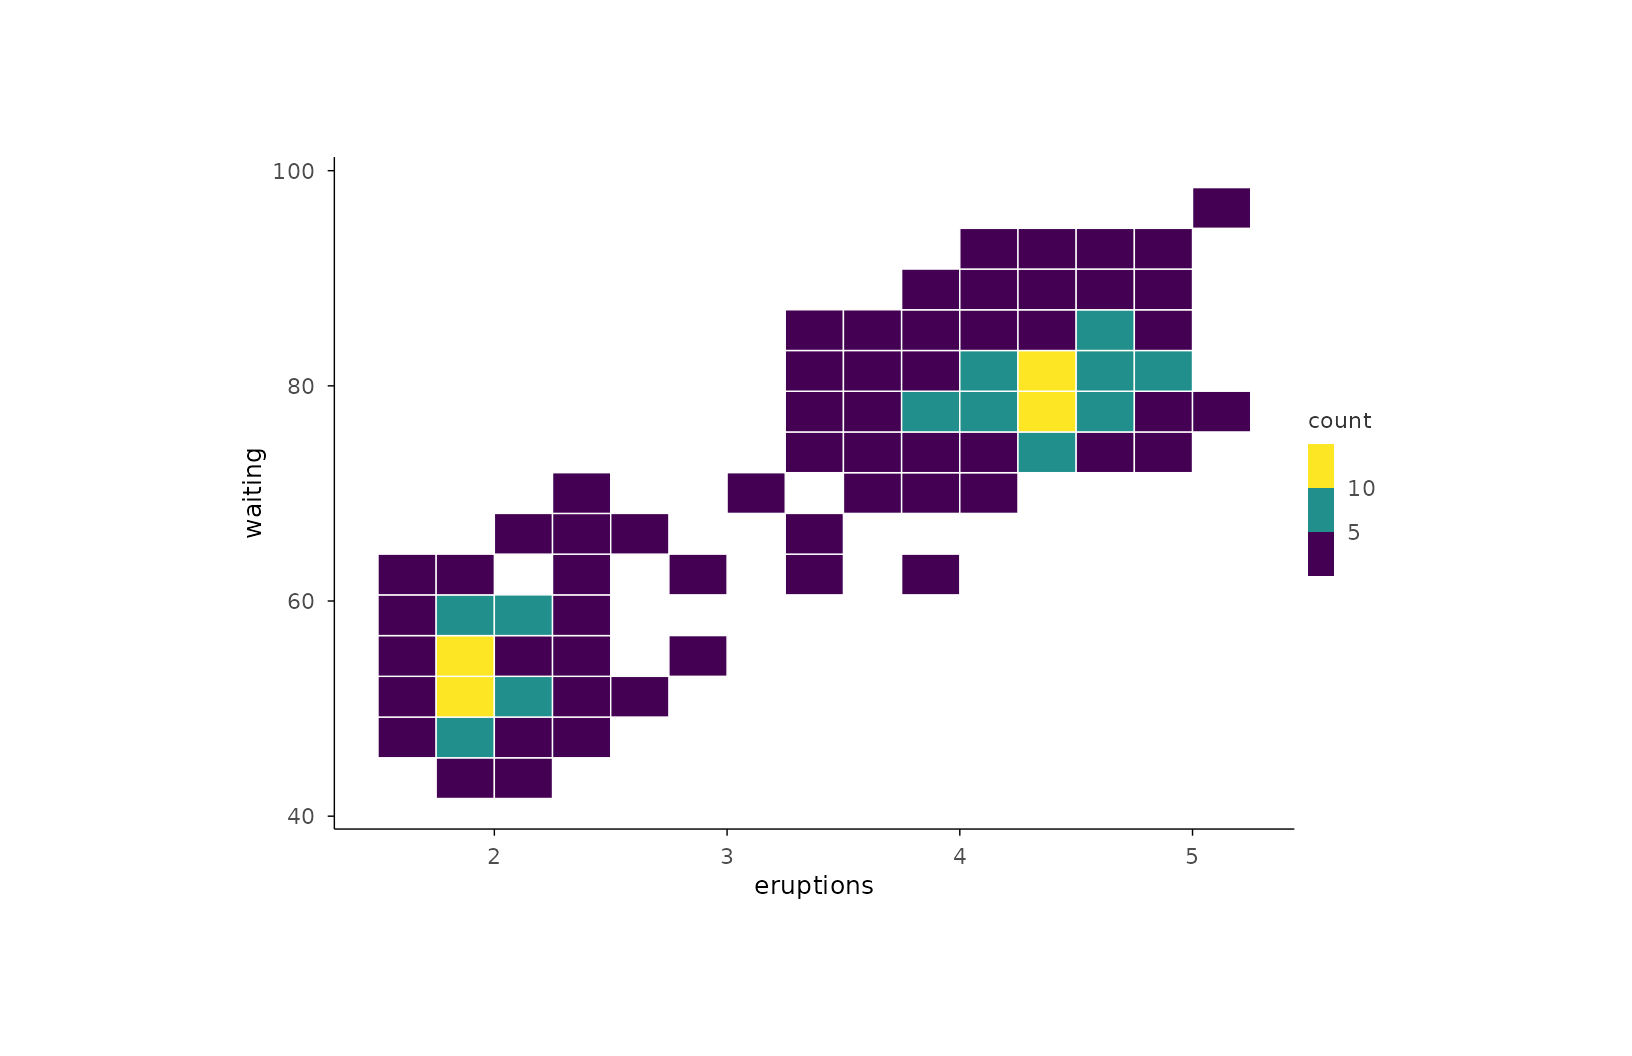
 plotit(faithful, encode(x = eruptions, y = waiting)) |>
mark_bin2d(bins = 15) |>
scale_fill(trans = "binned")
#> Scale for fill is already present.
#> Adding another scale for fill, which will replace the existing scale.
plotit(faithful, encode(x = eruptions, y = waiting)) |>
mark_bin2d(bins = 15) |>
scale_fill(trans = "binned")
#> Scale for fill is already present.
#> Adding another scale for fill, which will replace the existing scale.