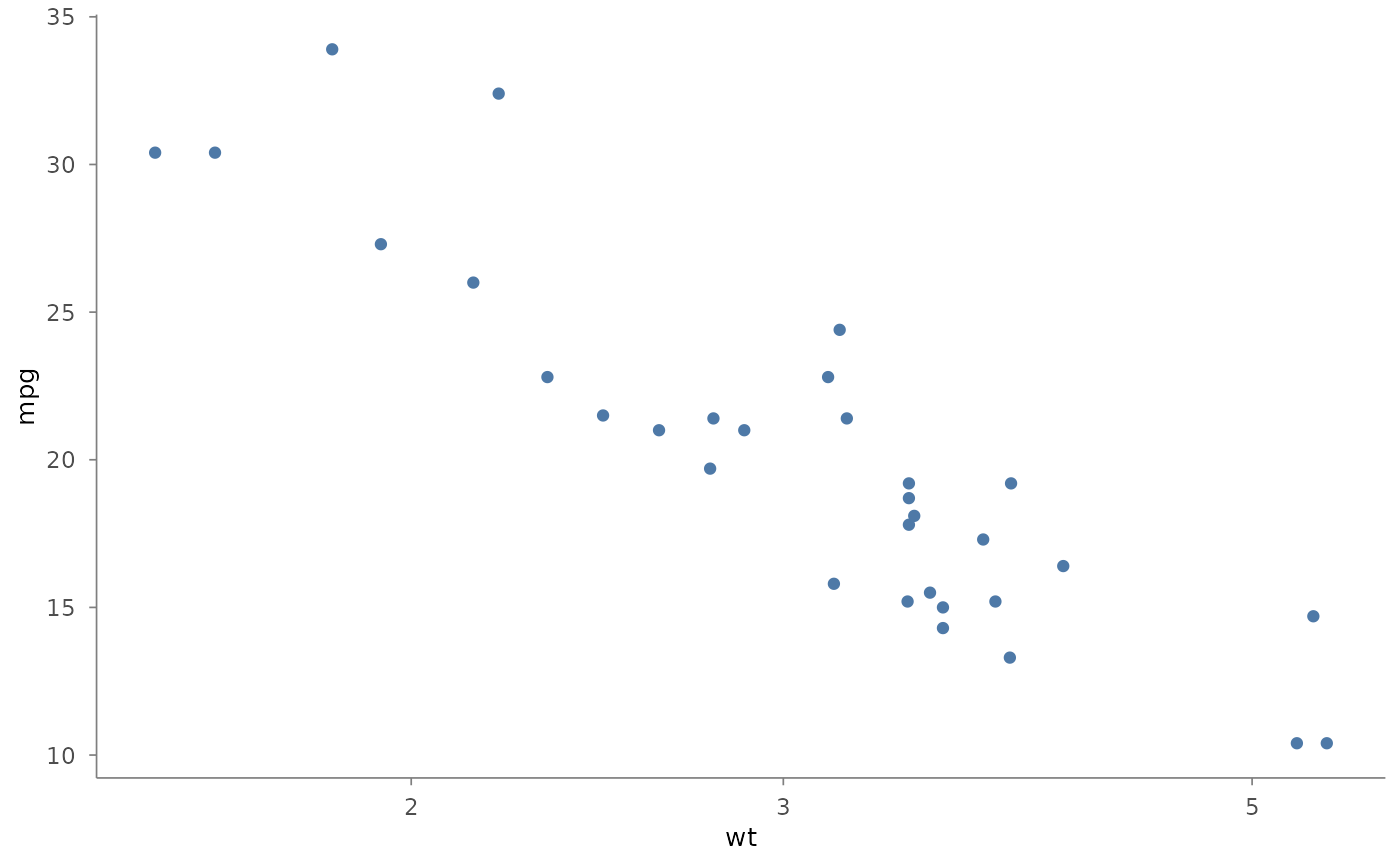
Controls the x-axis scale: transformation, limits, breaks, and labels.
Usage
scale_x(
  plot,
  name = ggplot2::waiver(),
  trans = "identity",
  limits = NULL,
  range = NULL,
  breaks = NULL,
  labels = NULL,
  ...
)
Arguments
- plot
A plotit object.
- name
Axis title.
ggplot2::waiver()= use variable name.- trans
Scale transformation. Default
"identity". Allowed:"identity","discrete","log","log10","log2","sqrt","reverse","binned".- limits
Axis limits as
c(min, max).- range
Normalized panel proportion as
c(min, max)in[0,1]. E.g.c(0.1, 0.9)maps data to the middle 80% of the panel.- breaks
Axis tick positions.
- labels
Axis tick labels.
- ...
Passed to the underlying ggplot2 scale function.
Examples
plotit(mtcars, encode(x = wt, y = mpg)) |>
  mark_point() |>
  scale_x(trans = "log10")