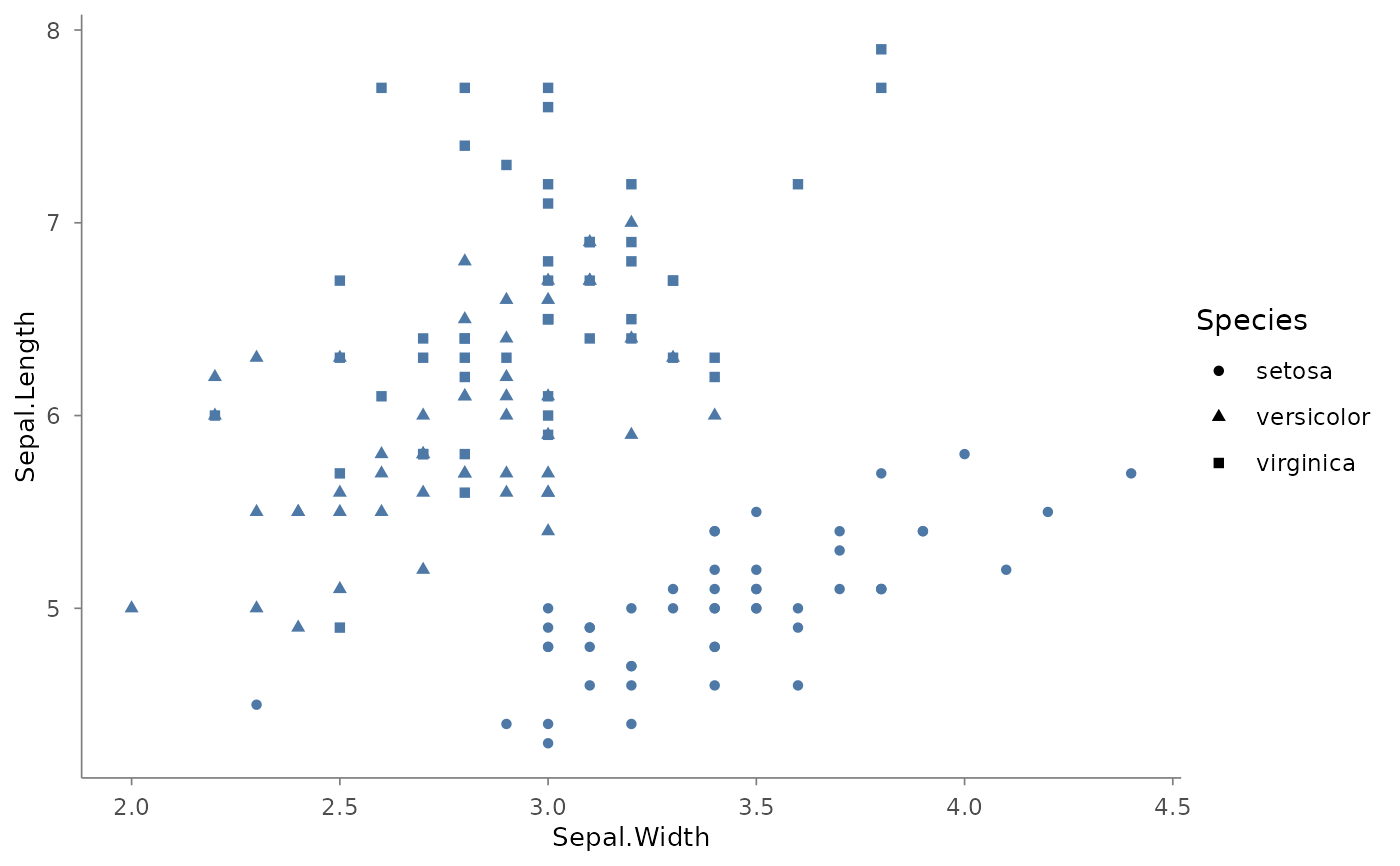
Maps data values to point shapes. Supports discrete and reverse scales; continuous variables are not supported (use binned via scale_colour instead).
Usage
scale_shape(
  plot,
  name = ggplot2::waiver(),
  trans = "discrete",
  limits = NULL,
  range = NULL,
  breaks = NULL,
  labels = NULL,
  ...
)
Arguments
- plot
A plotit object.
- name
Scale title (legend name).
- trans
Scale transformation. Default
"discrete". Allowed:"discrete","reverse"."identity"and"binned"are rejected with targeted error messages.- limits
Data domain.
- range
Shape numbers as
c(from, to).NULL= ggplot2 default shapes.- breaks
Legend key positions.
- labels
Legend key labels.
- ...
Passed to the underlying ggplot2 scale function.
Examples
plotit(iris, encode(x = Sepal.Width, y = Sepal.Length, shape = Species)) |>
  mark_point() |>
  scale_shape()