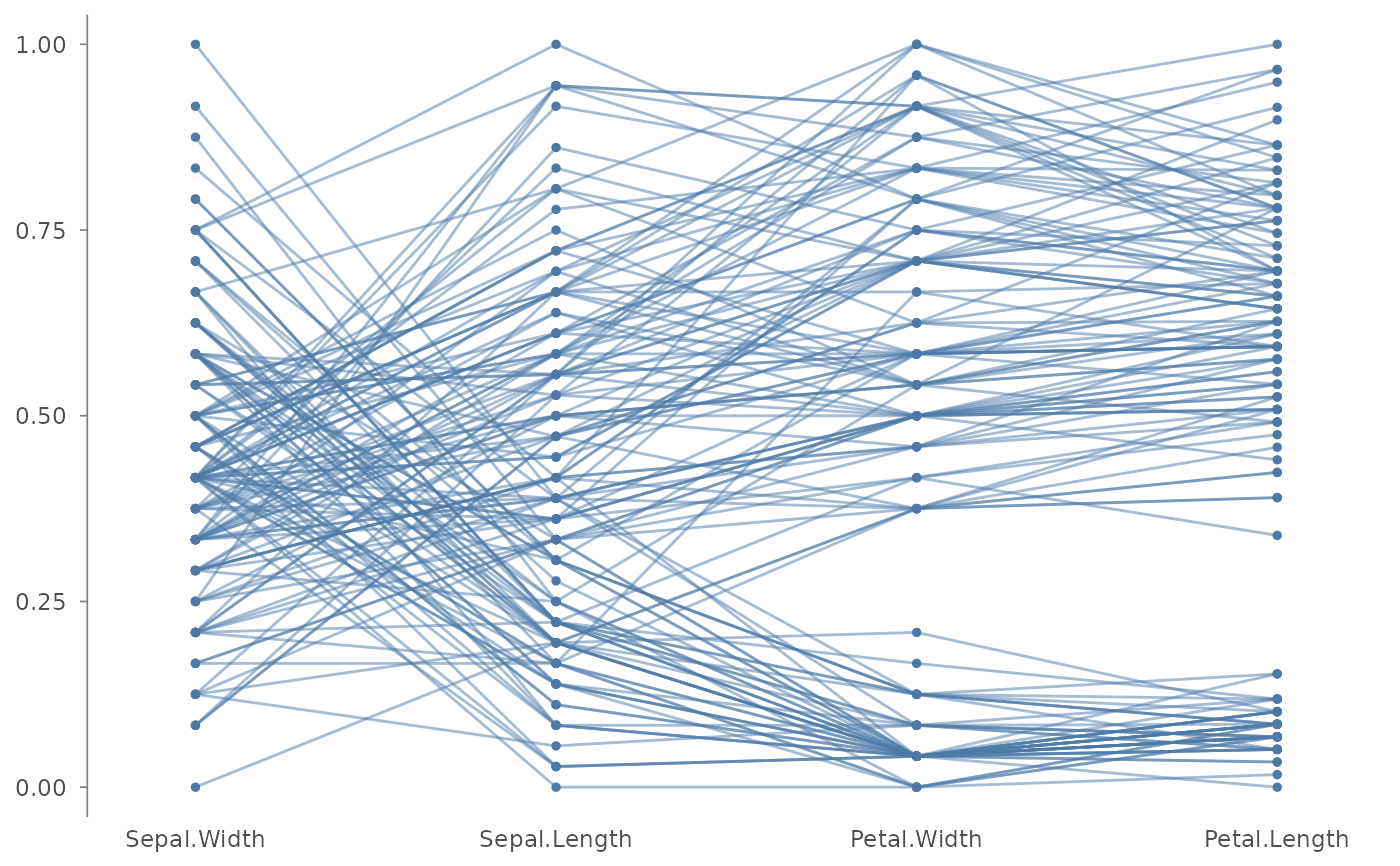
Reshapes the plot data so that the selected columns become parallel vertical axes. Each observation is drawn as a polyline connecting its values across all axes. Values are optionally normalised per column to share a common 0-1 scale.
Arguments
- plot
A plotit object.
- columns
Character vector of column names to use as parallel axes. Order matters: the first column is the leftmost axis.
- group
Column name for colouring lines.
NULL= no grouping.- scale
"std"(default): min-max normalise each column to 0-1."global": min-max normalise across all columns to 0-1."none": no normalisation, each column keeps its own range.- order
Axis order: character subset of
columns; axes render in the given order and omitted columns drop.NULL(default) keeps thecolumnsorder.- recenter
Reference axis for a difference-from-reference view: a column name; every polyline is re-expressed as its difference from that axis (normalised space), so the reference becomes a straight zero baseline.
NULLdisables.- aggregate
Group overlay:
"none"(default), or"mean"/"median"to draw one thick aggregate line per group behind the individual polylines (requiresgroup).- axis_labels
Draw the per-axis tick labels (default
TRUE);FALSEblanks them for a clean silhouette view.- alpha, size
Passed to
geom_line()/geom_point().- ...
Passed to
geom_line().