Adds a stair-step line layer: observations are connected with axis-parallel segments, so every change renders as an explicit jump. Use for discrete state changes over time, reference thresholds, or cumulative (ECDF-style) views.
Usage
mark_step(
  plot,
  mapping = NULL,
  data = NULL,
  position = NULL,
  ...,
  direction = c("vh", "hv", "mid"),
  rasterize = FALSE,
  rasterize_dpi = 300,
  rasterize_dev = "cairo"
)
Arguments
- plot
A plotit object
- mapping
Optional new aesthetics
- data
Optional data for this layer
- position
Position adjustment.
- ...
Other arguments passed to
geom_step- direction
"vh"(default) draws vertical-then-horizontal steps;"hv"the reverse;"mid"steps at the midpoint.- rasterize
If
TRUE, rasterize viaggrastr::rasterise().- rasterize_dpi
DPI for rasterization (default 300).
- rasterize_dev
Graphics device for rasterization (default
"cairo").
Examples
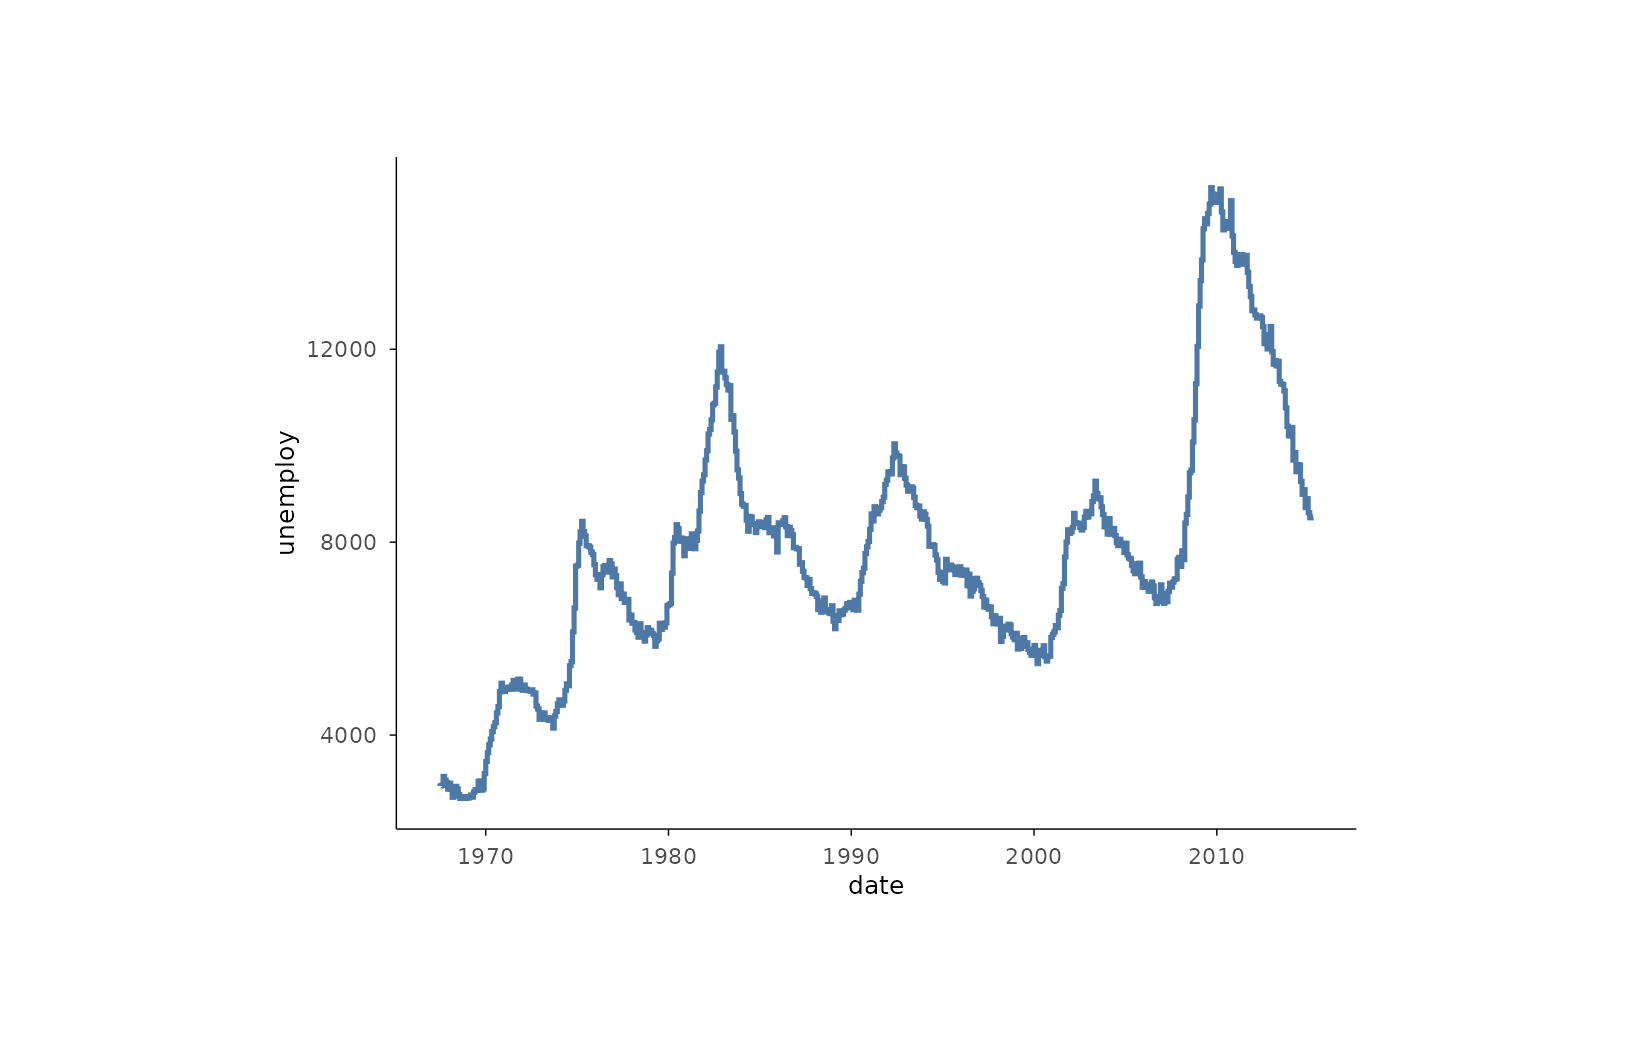
plotit(ggplot2::economics, encode(x = date, y = unemploy)) |>
mark_step()
 # horizontal-then-vertical steps
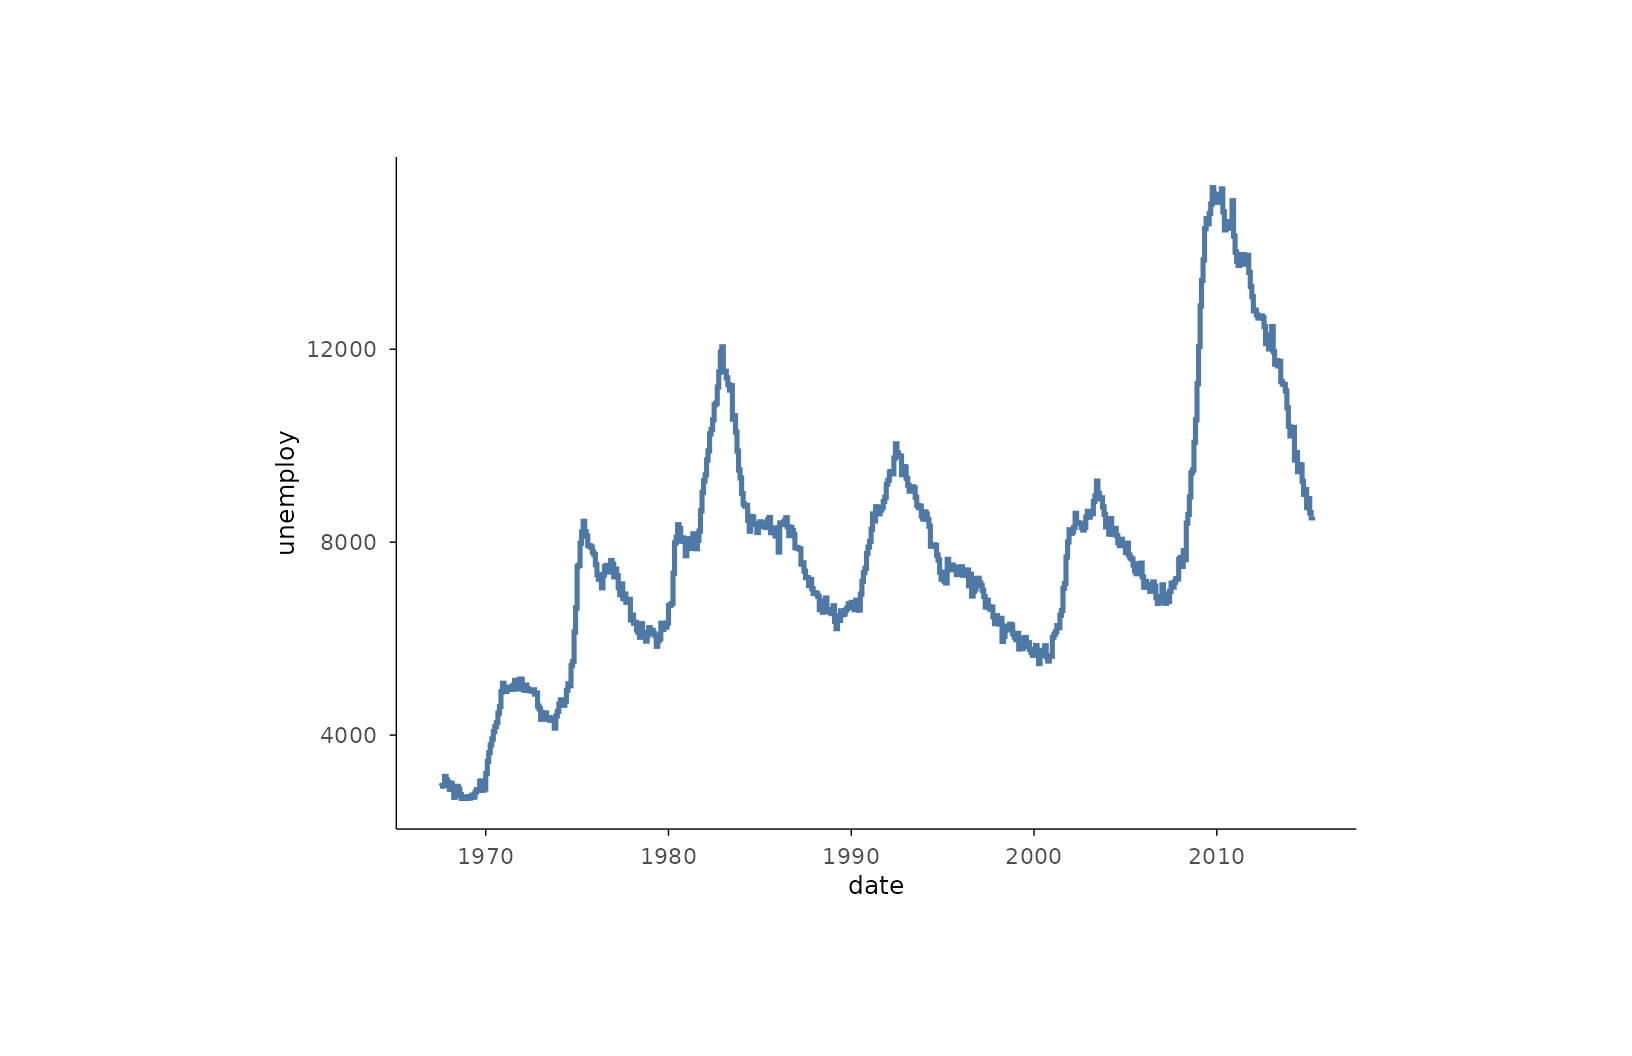
plotit(ggplot2::economics, encode(x = date, y = unemploy)) |>
mark_step(direction = "hv")
# horizontal-then-vertical steps
plotit(ggplot2::economics, encode(x = date, y = unemploy)) |>
mark_step(direction = "hv")
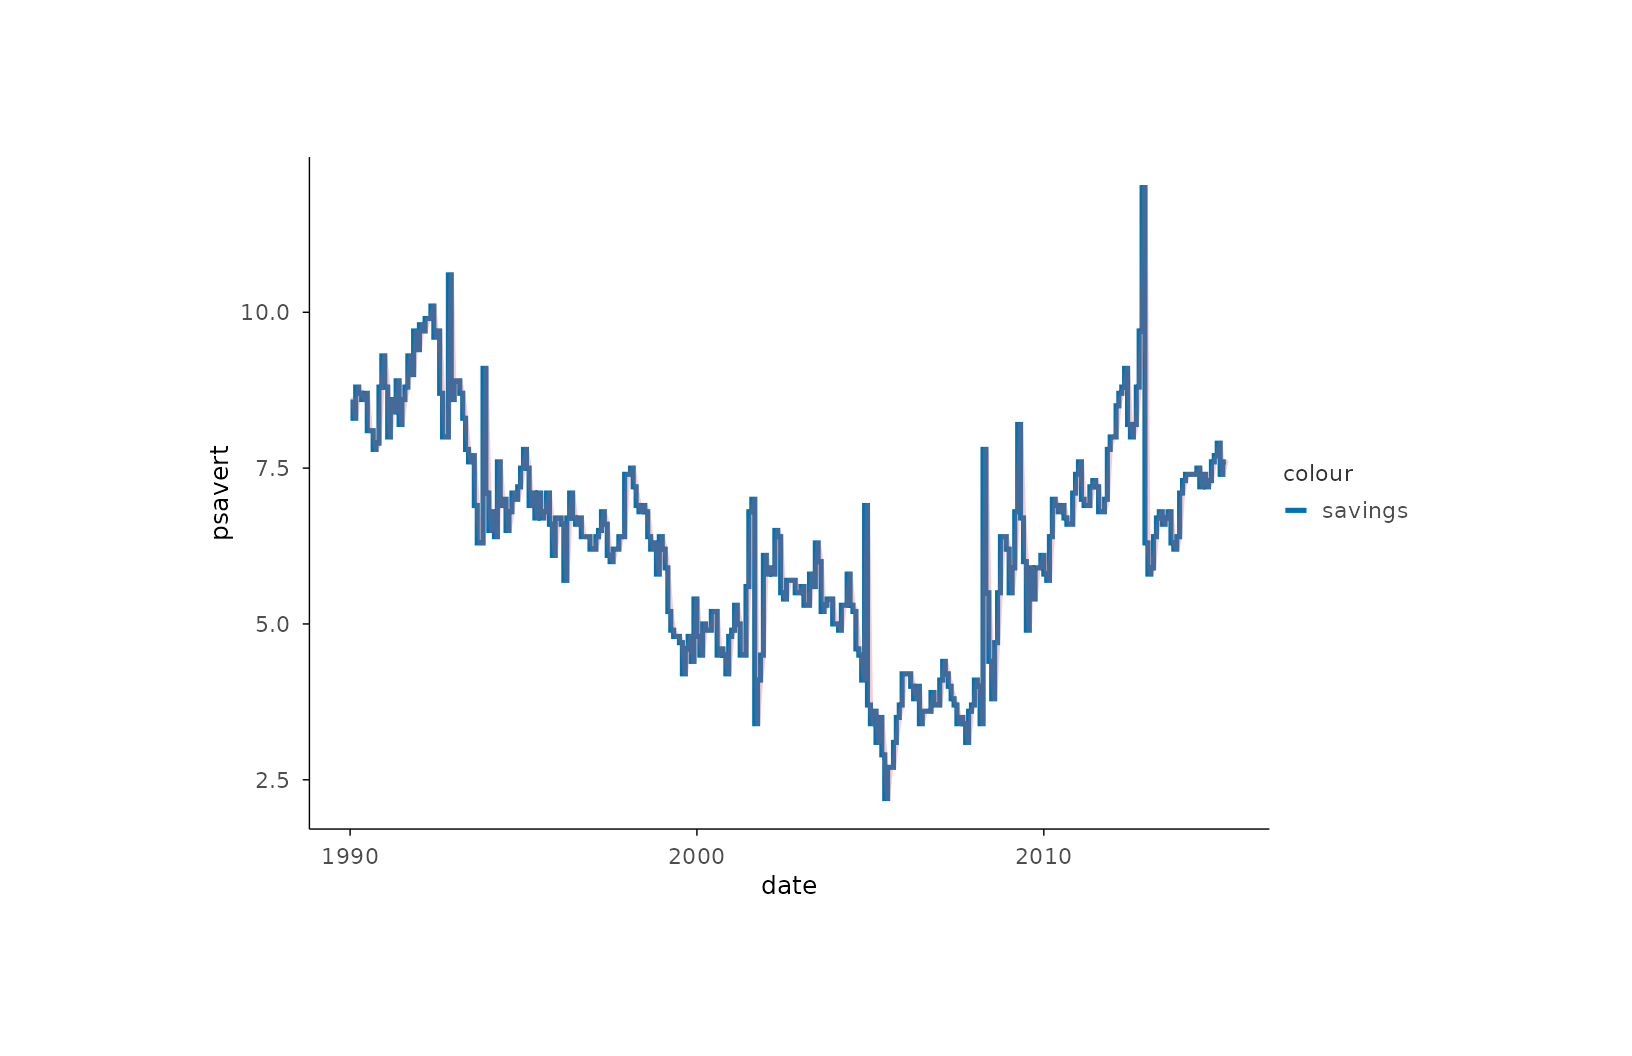
 # grouped steps
plotit(
subset(ggplot2::economics, date > "1990-01-01"),
encode(x = date, y = psavert, colour = "savings")
) |>
mark_step() |>
mark_line(colour = "#E15759", alpha = 0.3)
# grouped steps
plotit(
subset(ggplot2::economics, date > "1990-01-01"),
encode(x = date, y = psavert, colour = "savings")
) |>
mark_step() |>
mark_line(colour = "#E15759", alpha = 0.3)