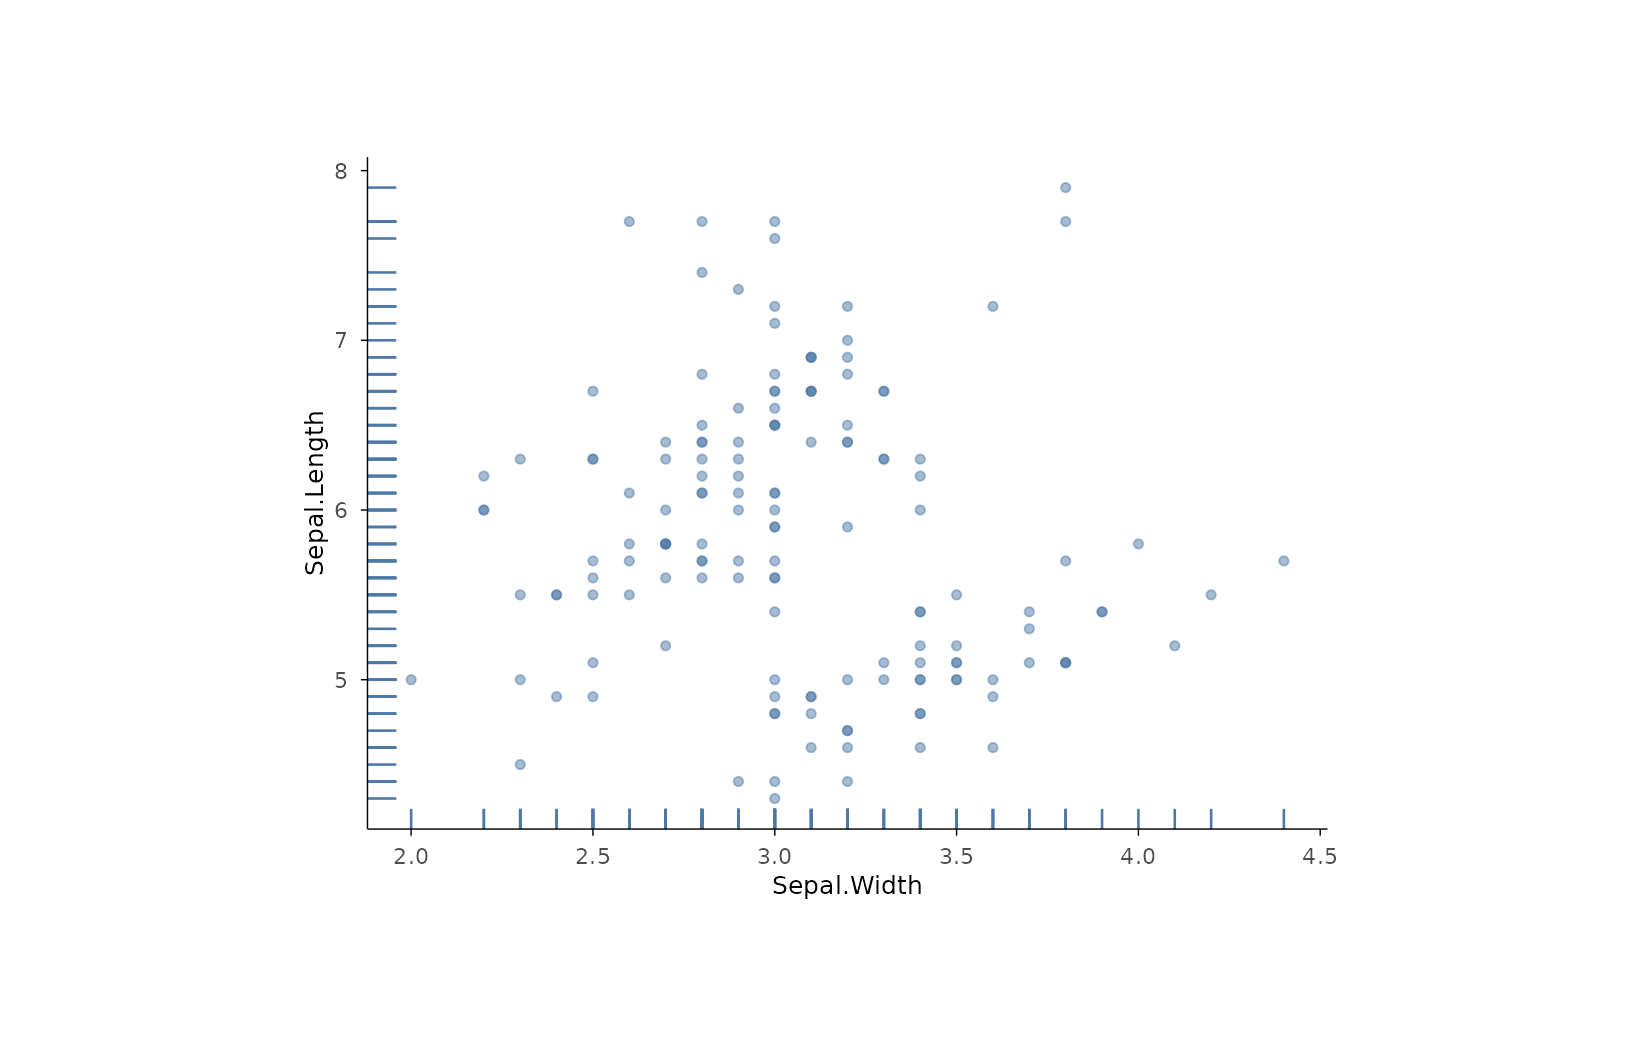
Adds marginal tick marks along the axes: one short segment per observation. Use for 1D marginals under a histogram or density, censoring ticks in survival timelines, or exact data positions behind a smoothed curve.
Usage
mark_rug(
  plot,
  mapping = NULL,
  data = NULL,
  position = NULL,
  ...,
  sides = "bl",
  length = NULL,
  rasterize = FALSE,
  rasterize_dpi = 300,
  rasterize_dev = "cairo"
)
Arguments
- plot
A plotit object
- mapping
Optional new aesthetics
- data
Optional data for this layer
- position
Position adjustment.
- ...
Other arguments passed to
geom_rug- sides
Which sides to draw on: any combination of
"b"(bottom),"l"(left),"t"(top),"r"(right). Default"bl".- length
Tick length as a fraction of the panel (default 0.03).
- rasterize
If
TRUE, rasterize viaggrastr::rasterise().- rasterize_dpi
DPI for rasterization (default 300).
- rasterize_dev
Graphics device for rasterization (default
"cairo").
Examples
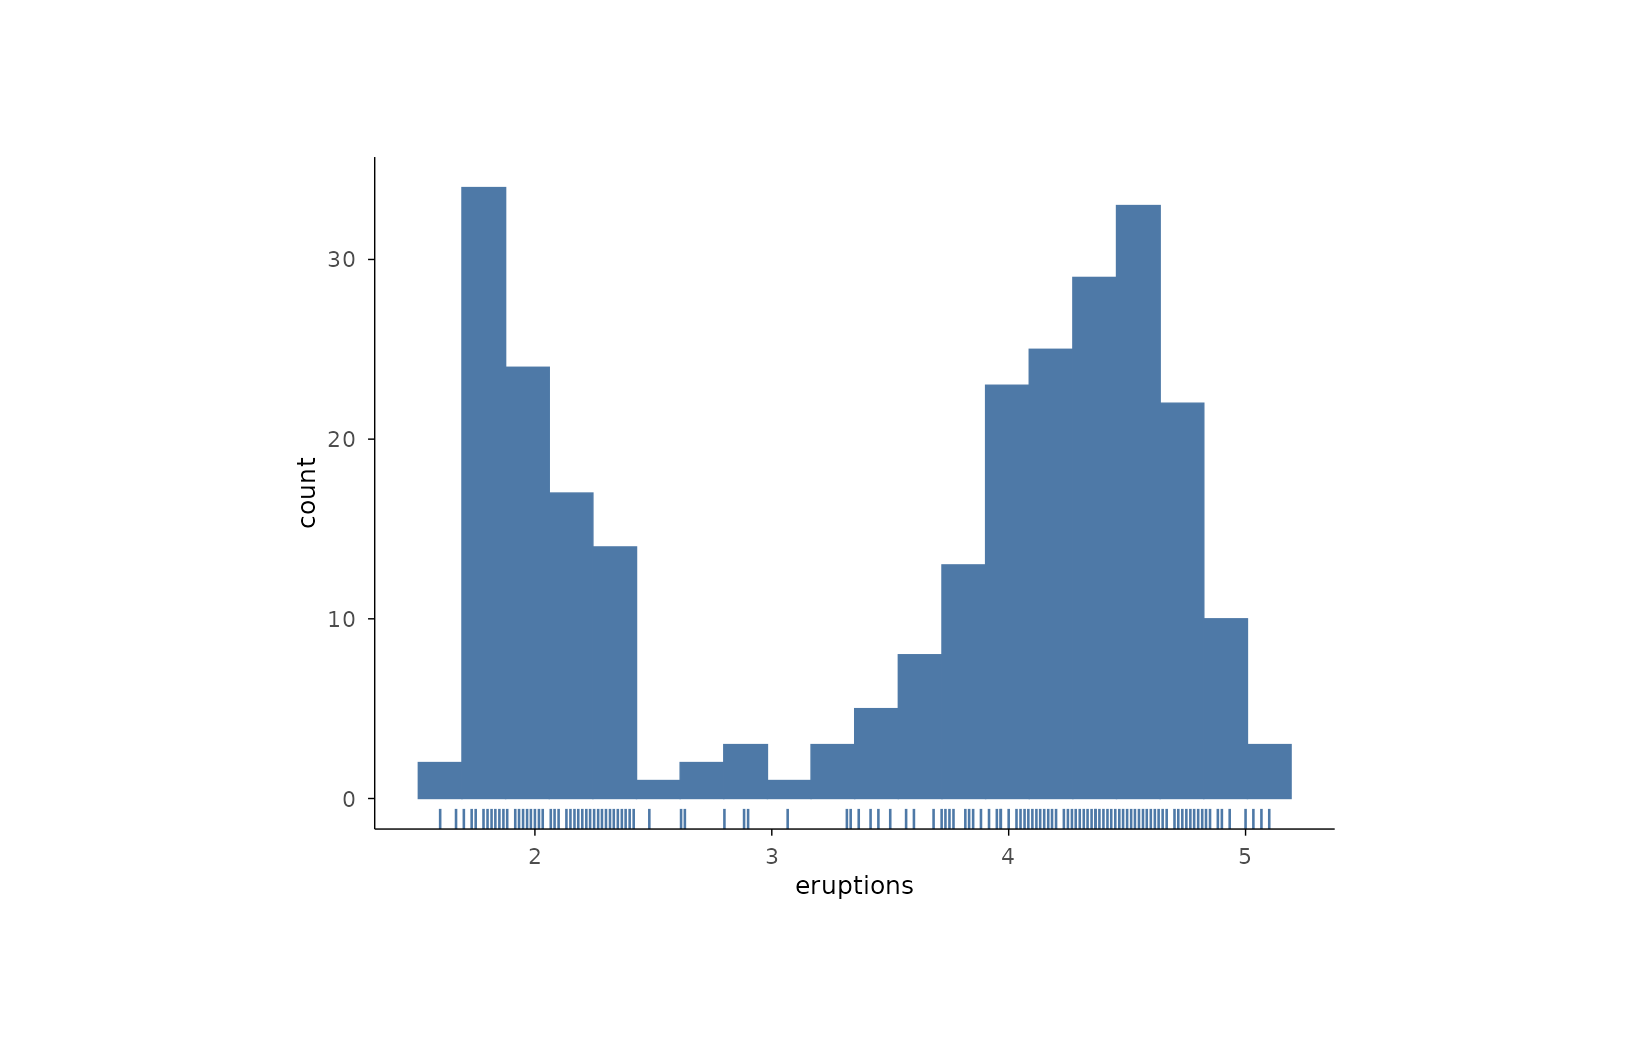
plotit(faithful, encode(x = eruptions)) |>
mark_histogram(bins = 20) |>
mark_rug()
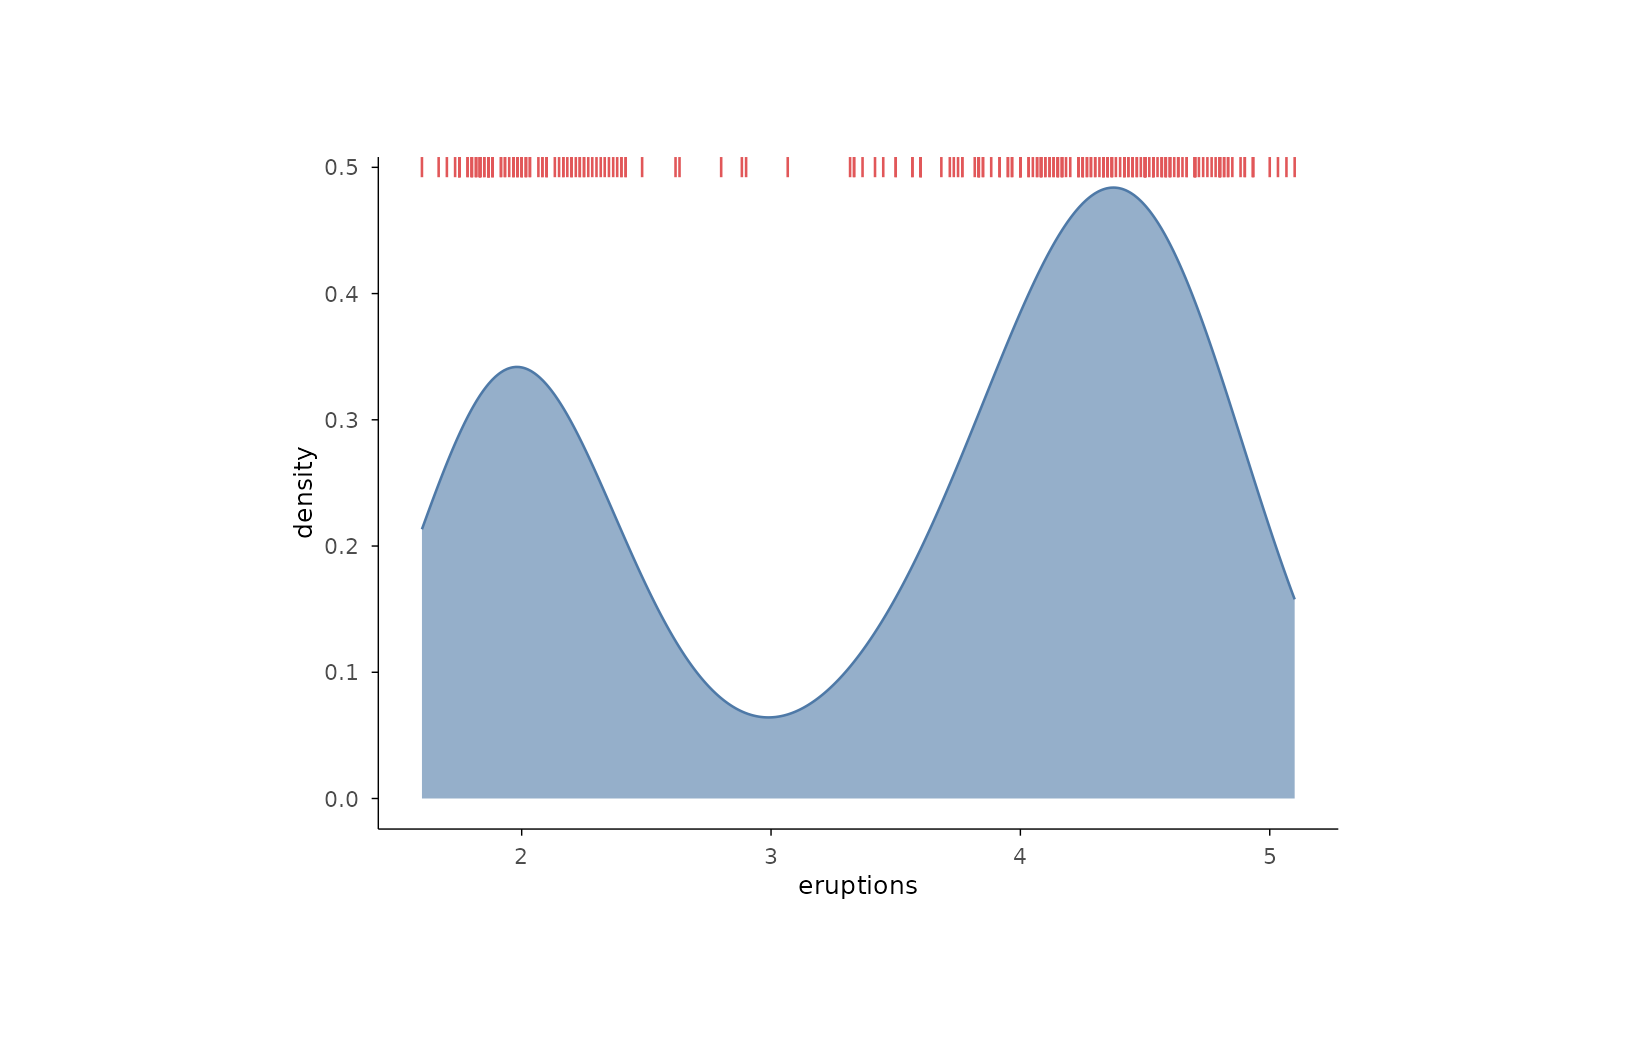
 # top rug to frame a density
plotit(faithful, encode(x = eruptions)) |>
mark_density() |>
mark_rug(sides = "t", color = "#E15759")
# top rug to frame a density
plotit(faithful, encode(x = eruptions)) |>
mark_density() |>
mark_rug(sides = "t", color = "#E15759")
 # two 1D marginals beside a scatter
plotit(iris, encode(x = Sepal.Width, y = Sepal.Length)) |>
mark_point(alpha = 0.5) |>
mark_rug(sides = "bl")
# two 1D marginals beside a scatter
plotit(iris, encode(x = Sepal.Width, y = Sepal.Length)) |>
mark_point(alpha = 0.5) |>
mark_rug(sides = "bl")