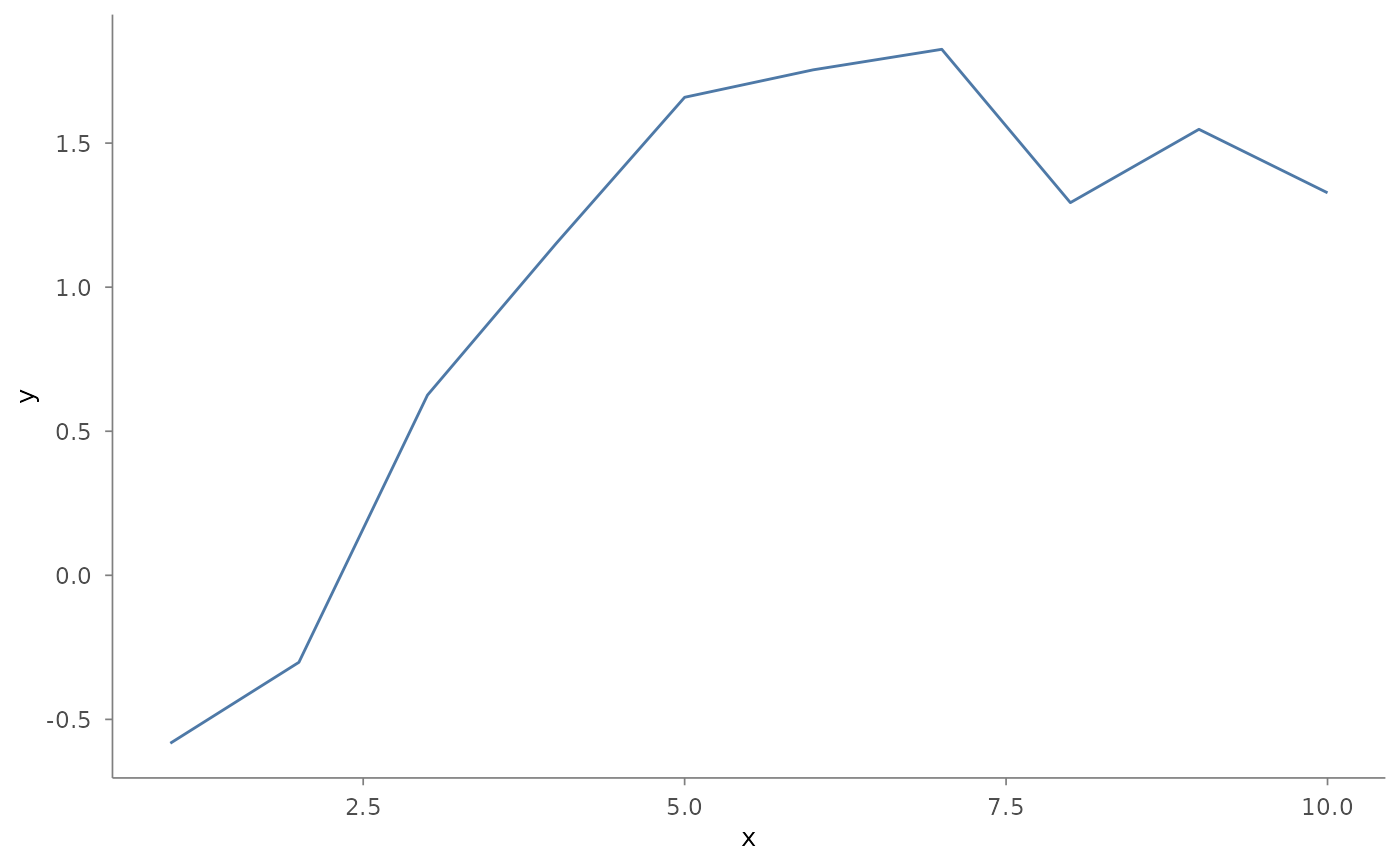
Adds a path layer connecting observations in their original order. Use for trajectories, time-ordered connected points, or custom drawing orders.
Usage
mark_path(
  plot,
  mapping = NULL,
  data = NULL,
  position = NULL,
  ...,
  rasterize = FALSE,
  rasterize_dpi = 300,
  rasterize_dev = "cairo"
)
Arguments
- plot
A plotit object
- mapping
Optional new aesthetics
- data
Optional data for this layer
- position
Position adjustment.
- ...
Other arguments passed to
geom_path- rasterize
If
TRUE, rasterize viaggrastr::rasterise().- rasterize_dpi
DPI for rasterization (default 300).
- rasterize_dev
Graphics device for rasterization (default
"cairo").
References
AntV G2: Path
Examples
df <- data.frame(x = 1:10, y = cumsum(runif(10, -1, 1)))
plotit(df, encode(x = x, y = y)) |> mark_path()