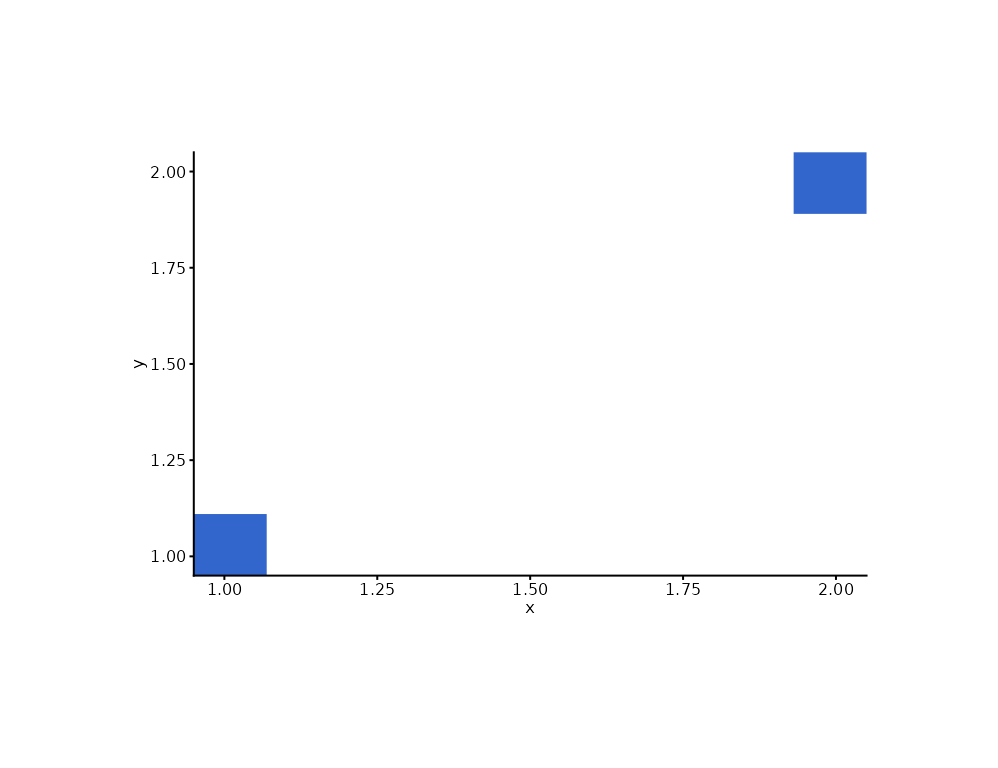
Places an image at each (x, y): the isotype / photo-scatter mark
(Observable Plot Image). Sources are png/jpeg file paths, http(s)
URLs, or pre-read raster arrays (e.g. via magick); arrays skip
decoding entirely. A single size sets the image's larger dimension
as a fraction of the panel and the aspect ratio is preserved
(clip = "circle" crops to a disc).
Usage
mark_image(
  plot,
  mapping = NULL,
  data = NULL,
  position = NULL,
  ...,
  size = 0.05,
  clip = "rectangle",
  interpolate = TRUE,
  rasterize = FALSE,
  rasterize_dpi = 300,
  rasterize_dev = "cairo"
)
Arguments
- plot
A plotit object
- mapping
Optional aesthetics:
x,y,src- data
Optional data for this layer
- position
Position adjustment.
- ...
Other arguments passed to the internal layer constructor. Rotation (Observable Plot
rotate) is a recorded extension position, not implemented.- size
Larger image dimension as a fraction of the panel (default 0.05).
- clip
"rectangle"(default) or"circle"(crop to a disc).- interpolate
Pass smooth interpolation to the raster (default
TRUE;FALSEkeeps pixel edges crisp, useful for large-scale isotype tiles).- rasterize
If
TRUE, rasterize viaggrastr::rasterise().- rasterize_dpi
DPI for rasterization (default 300).
- rasterize_dev
Graphics device for rasterization (default
"cairo").
Details
Rows with NA or empty src are dropped. Images are decoded once per
source and cached for the session. Like any glyph, an image that would
extend past the data range is clipped by the panel: boundary placements
should widen the scale limits (e.g. scale_x(limits = c(0, 4))).
References
Observable Plot: Plot.image (src channel, round clip, imageRendering)
AntV G2: image (via G2 mark extensions)