Adds interval bars showing pre-computed intervals (stat = "identity",
the default: ymin/ymax come straight from the data) or statistical
entities computed per group (stat = "mean_sem", "mean_sd",
"mean_range", "mean_ci95"): the interval is aggregated from the raw
y values of each x group with no manual pre-computation.
Arguments
- plot
A plotit object
- mapping
Optional new aesthetics. With
stat = "identity"it must include the interval columns for the chosen orientation (ymin/ymaxvertical,xmin/xmaxhorizontal); with a statistical entity it only needsx(group) andy(value).- data
Optional data for this layer
- position
Position adjustment.
- ...
Other arguments passed to the underlying geom
- stat
Statistical entity:
"identity"(pre-computed intervals, no implicit aggregation) or one of"mean_sem","mean_sd","mean_range","mean_ci95"(per-group aggregation ofy).- level
Confidence level for
stat = "mean_ci95", in(0, 1)(default 0.95).- ci_method
"normal"(default, t-based normal approximation) or"boot"(percentile bootstrap of the mean; requiresseed).- seed
RNG seed for
ci_method = "boot"; required for reproducibility of the bootstrap.- width
Size of the error bar caps as a fraction of the resolution of the data. When
NULL(default) the style tokenwidth_errorbar(0.4) applies forcaps = TRUE. Ignored whencaps = FALSE.- orientation
"vertical"(default) or"horizontal".- caps
If
TRUE(default), draw end caps;FALSErenders bare interval lines (geom_linerange).- rasterize
If
TRUE, rasterize viaggrastr::rasterise().- rasterize_dpi
DPI for rasterization (default 300).
- rasterize_dev
Graphics device for rasterization (default
"cairo").
Details
Vertical bars (default) map the position on x and the interval on
ymin/ymax; horizontal bars map the position on y and the interval
on xmin/xmax (G2's rangeX/rangeY semantics). Set caps = FALSE
for plain interval lines without end caps (Vega-Lite's errorband).
References
Vega-Lite: Errorbar /
Errorband
(extent: stderr <-> sem, stdev <-> sd, ci <-> ci95)
AntV G2: Range
Examples
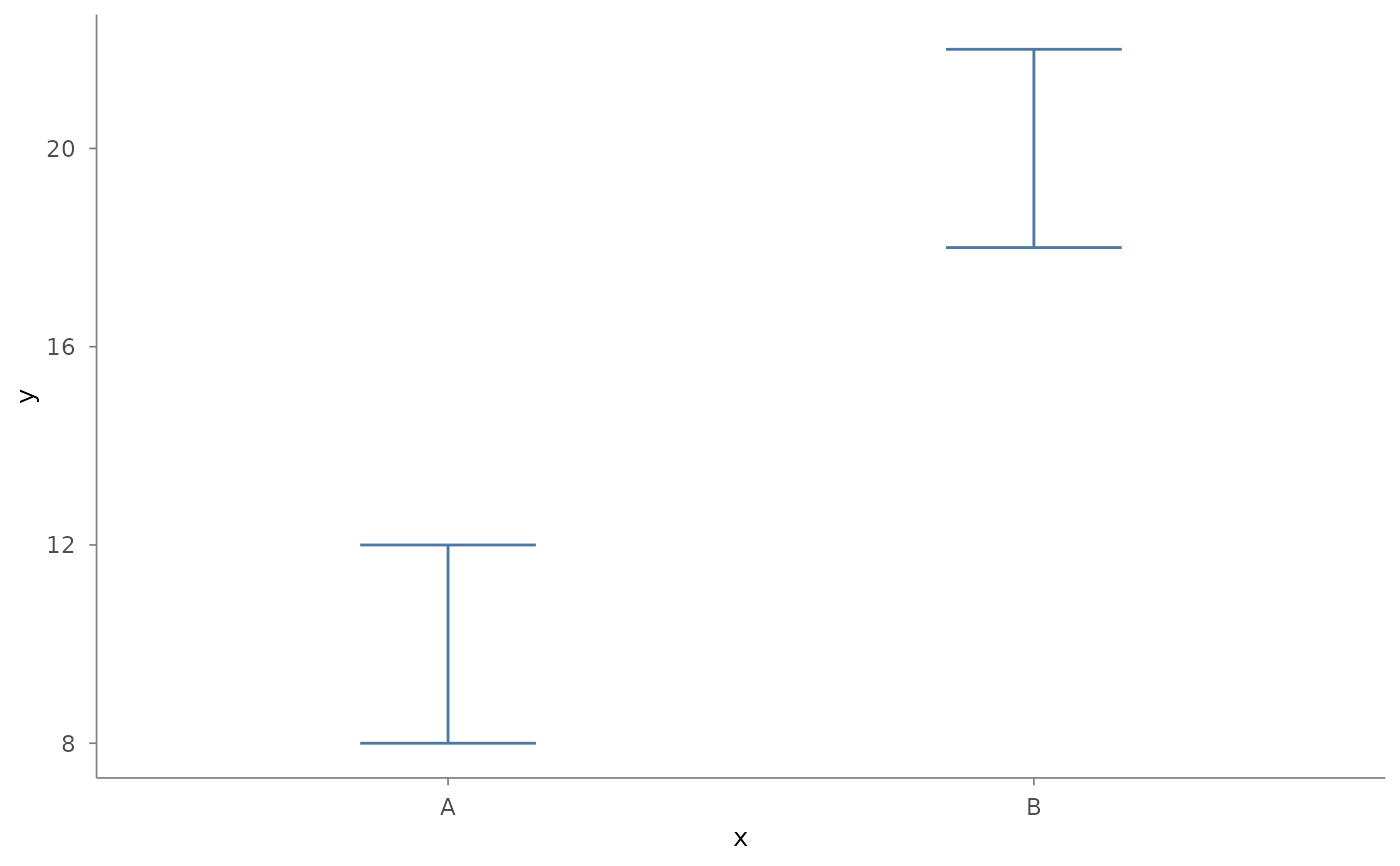
df <- data.frame(
x = c("A", "B"), y = c(10, 20), ymin = c(8, 18), ymax = c(12, 22)
)
plotit(df, encode(x = x, y = y, ymin = ymin, ymax = ymax)) |>
mark_errorbar(width = 0.3)
 # statistical entity: mean +- sem aggregated per group from raw y
plotit(iris, encode(x = Species, y = Sepal.Length)) |>
mark_errorbar(stat = "mean_sem")
# statistical entity: mean +- sem aggregated per group from raw y
plotit(iris, encode(x = Species, y = Sepal.Length)) |>
mark_errorbar(stat = "mean_sem")
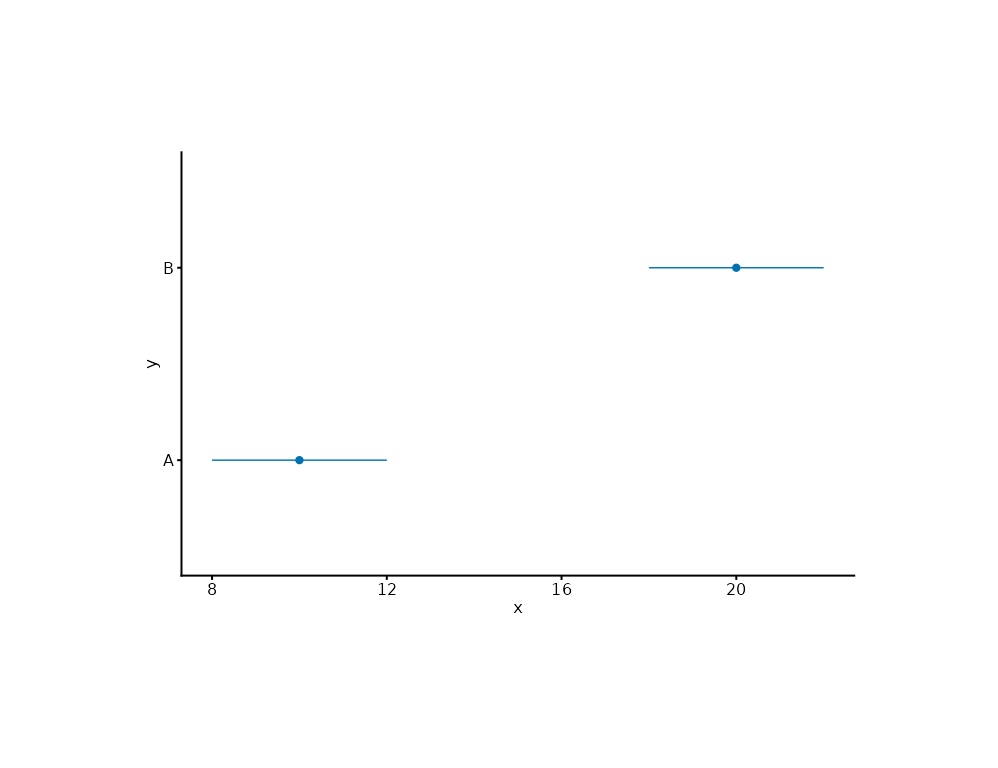
 # horizontal interval (position on y, range on x)
dfh <- data.frame(
y = c("A", "B"), x = c(10, 20), xmin = c(8, 18), xmax = c(12, 22)
)
plotit(dfh, encode(x = x, y = y, xmin = xmin, xmax = xmax)) |>
mark_point() |>
mark_errorbar(orientation = "horizontal", caps = FALSE)
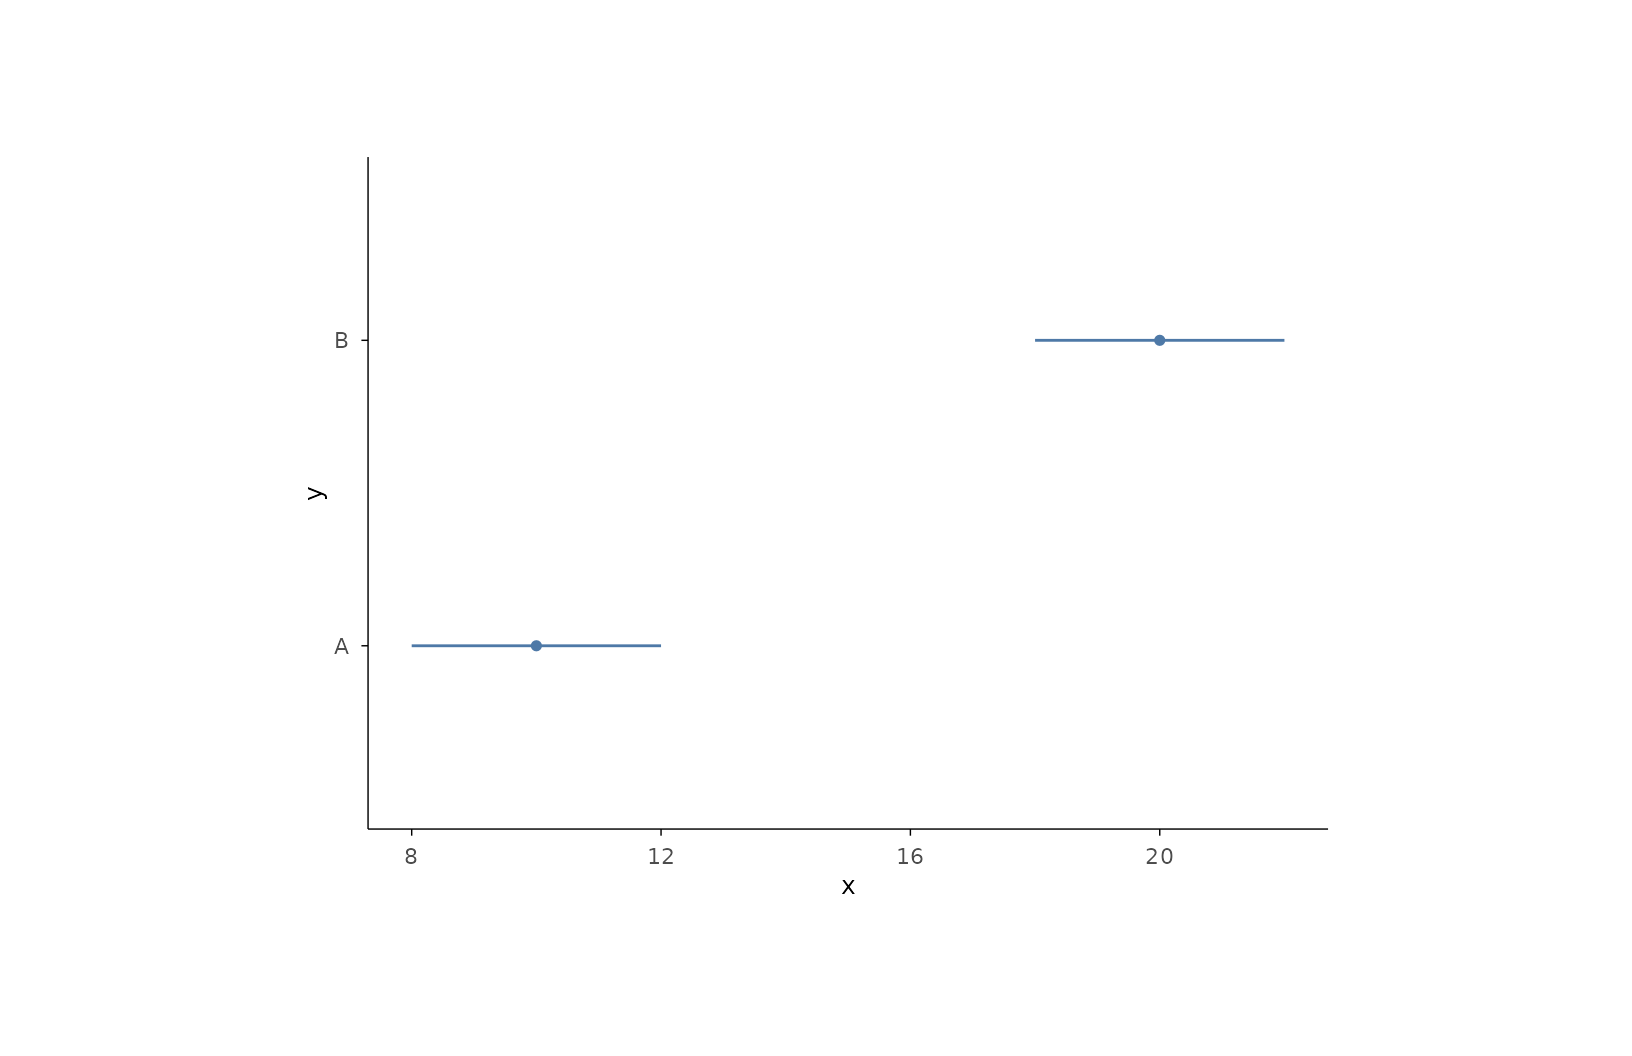
# horizontal interval (position on y, range on x)
dfh <- data.frame(
y = c("A", "B"), x = c(10, 20), xmin = c(8, 18), xmax = c(12, 22)
)
plotit(dfh, encode(x = x, y = y, xmin = xmin, xmax = xmax)) |>
mark_point() |>
mark_errorbar(orientation = "horizontal", caps = FALSE)