Draws curved segments between (x, y) and (xend, yend) endpoints –
the link/diagram edge for arc diagrams, bipartite layouts and network
charts, where straight rules overlap node labels. Arrows are available
through arrow = grid::arrow() via ....
Usage
mark_curve(
  plot,
  mapping = NULL,
  data = NULL,
  position = NULL,
  ...,
  curvature = 0.5,
  angle = 90,
  arrow = NULL,
  rasterize = FALSE,
  rasterize_dpi = 300,
  rasterize_dev = "cairo"
)
Arguments
- plot
A plotit object
- mapping
Optional new aesthetics (must include
x,y,xend,yend; layout tables bind them automatically)- data
Optional data for this layer; accepts a
~tablegraph reference- position
Position adjustment.
- ...
Other arguments passed to
geom_curve- curvature
Amount of curvature:
1is a semicircle, smaller values are flatter, negative values bend the other way (default 0.5).- angle
Angle at which the curve approaches the endpoint, in degrees (default 90).
- arrow
Optional
grid::arrow()object to draw arrow heads.- rasterize
If
TRUE, rasterize viaggrastr::rasterise().- rasterize_dpi
DPI for rasterization (default 300).
- rasterize_dev
Graphics device for rasterization (default
"cairo").
Examples
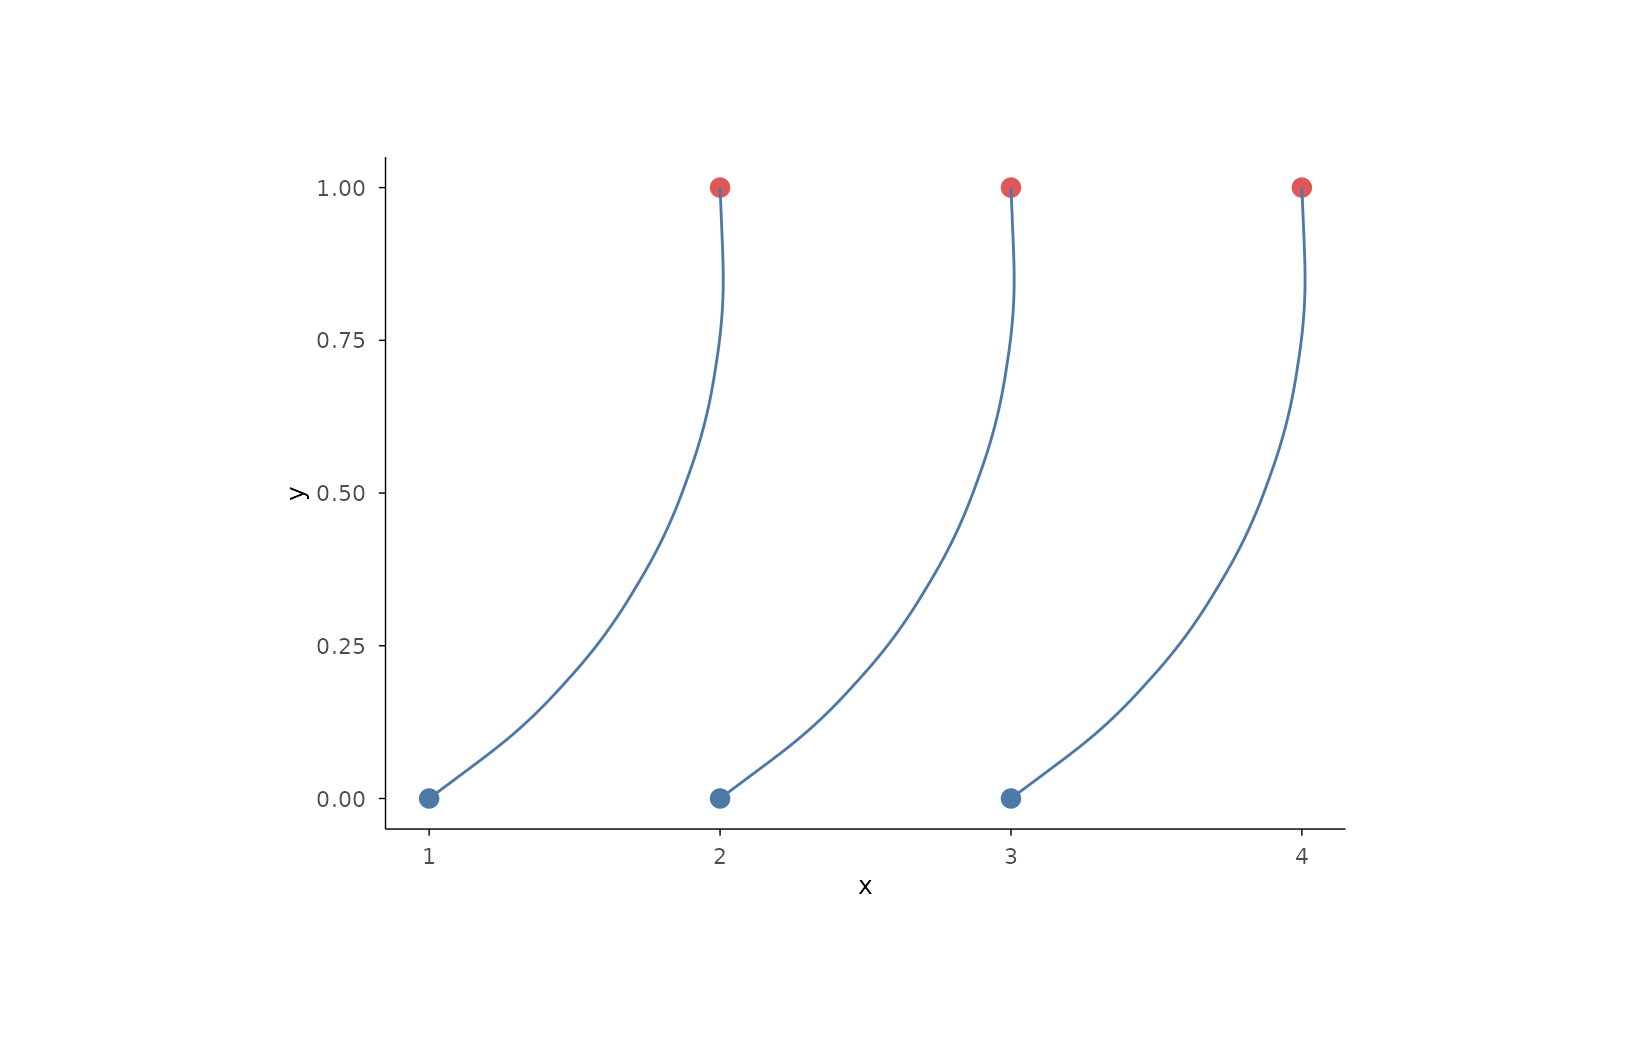
edges <- data.frame(
x = c(1, 2, 3), y = c(0, 0, 0),
xend = c(2, 3, 4), yend = c(1, 1, 1)
)
plotit(edges, encode(x = x, y = y, xend = xend, yend = yend)) |>
mark_point(colour = "#4E79A7", size = 3) |>
mark_point(
mapping = encode(x = xend, y = yend),
colour = "#E15759", size = 3
) |>
mark_curve(curvature = 0.3)
 # curved flow with arrows
plotit(edges, encode(x = x, y = y, xend = xend, yend = yend)) |>
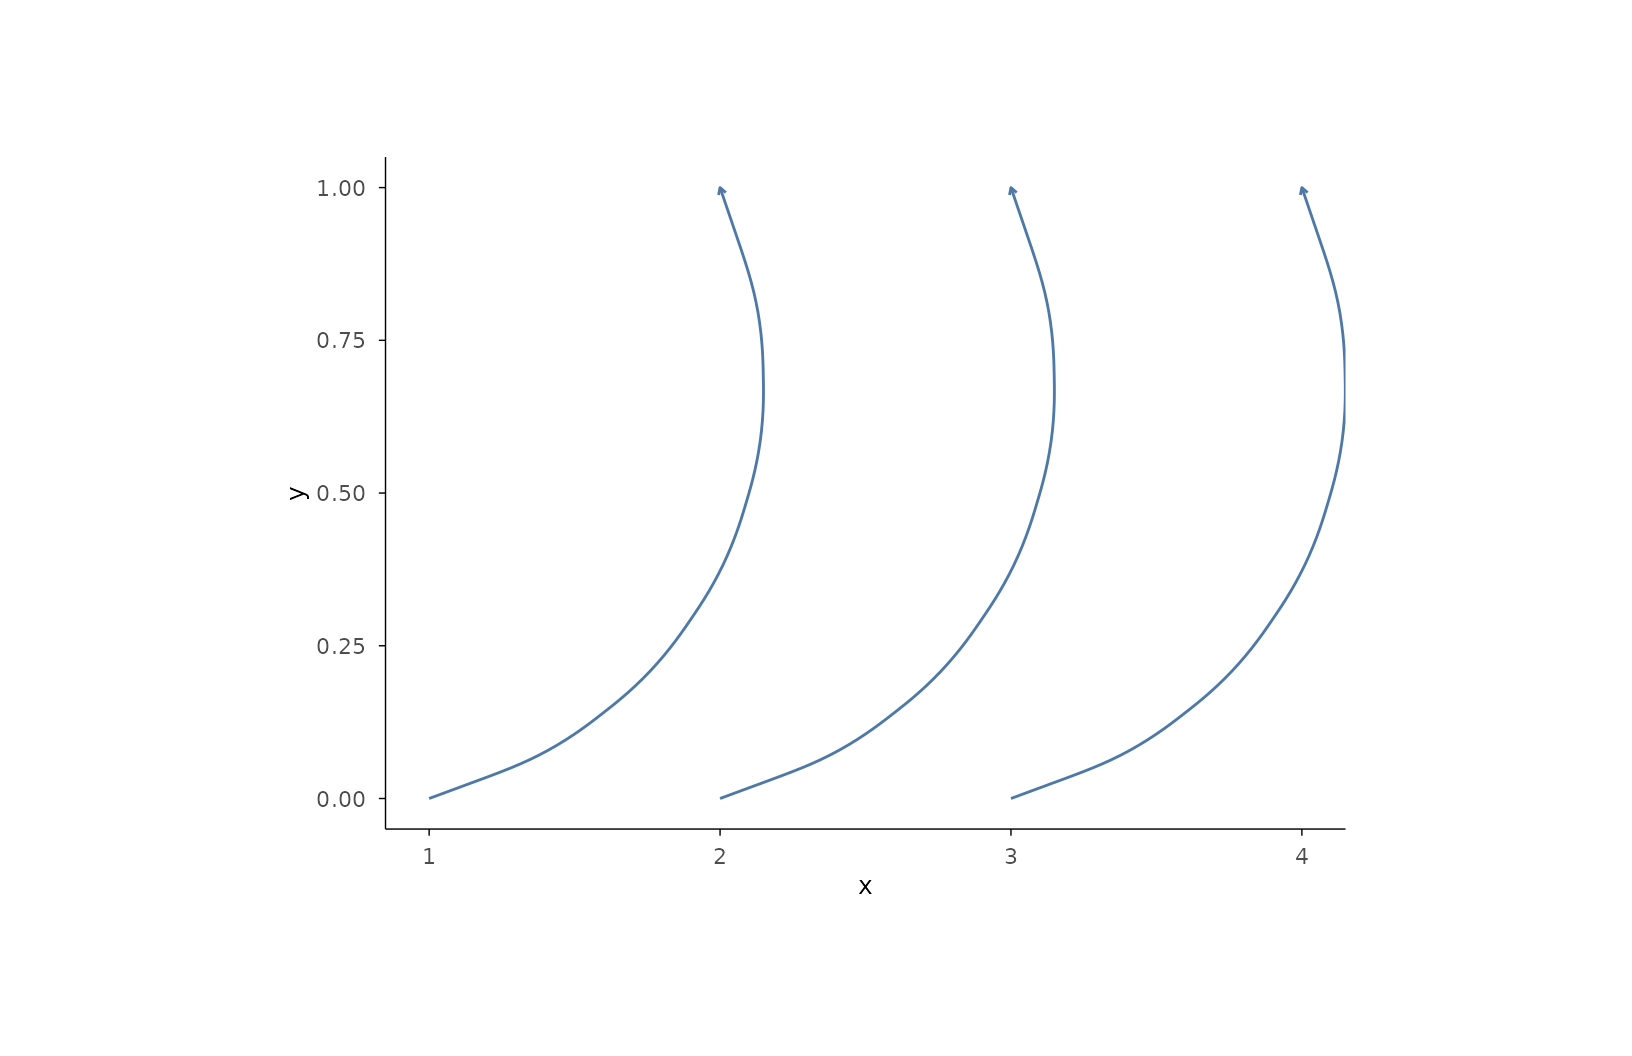
mark_curve(arrow = grid::arrow(length = grid::unit(0.1, "cm")))
# curved flow with arrows
plotit(edges, encode(x = x, y = y, xend = xend, yend = yend)) |>
mark_curve(arrow = grid::arrow(length = grid::unit(0.1, "cm")))