Positions nodes with a self-contained Fruchterman-Reingold force
simulation (attractive edge forces, pairwise repulsion, linear cooling).
No external dependency; runs are deterministic when seed is given.
Node table gains x/y; edge table gains x, y, xend, yend.
Arguments
- plot
A
plotitobject holding graph data (created viaas_graph()+plotit()), or a bareplotit_graph.- iterations
Number of simulation steps.
- seed
Random seed; pass one for reproducible output.
- ...
Optional named argument
weights: non-negative numeric vector, one per edge – higher weights pull endpoints closer together. Any other name is ignored with a warning.
Value
A modified plotit object (pipeline form), or a new
plotit_graph when called on raw graph data.
Examples
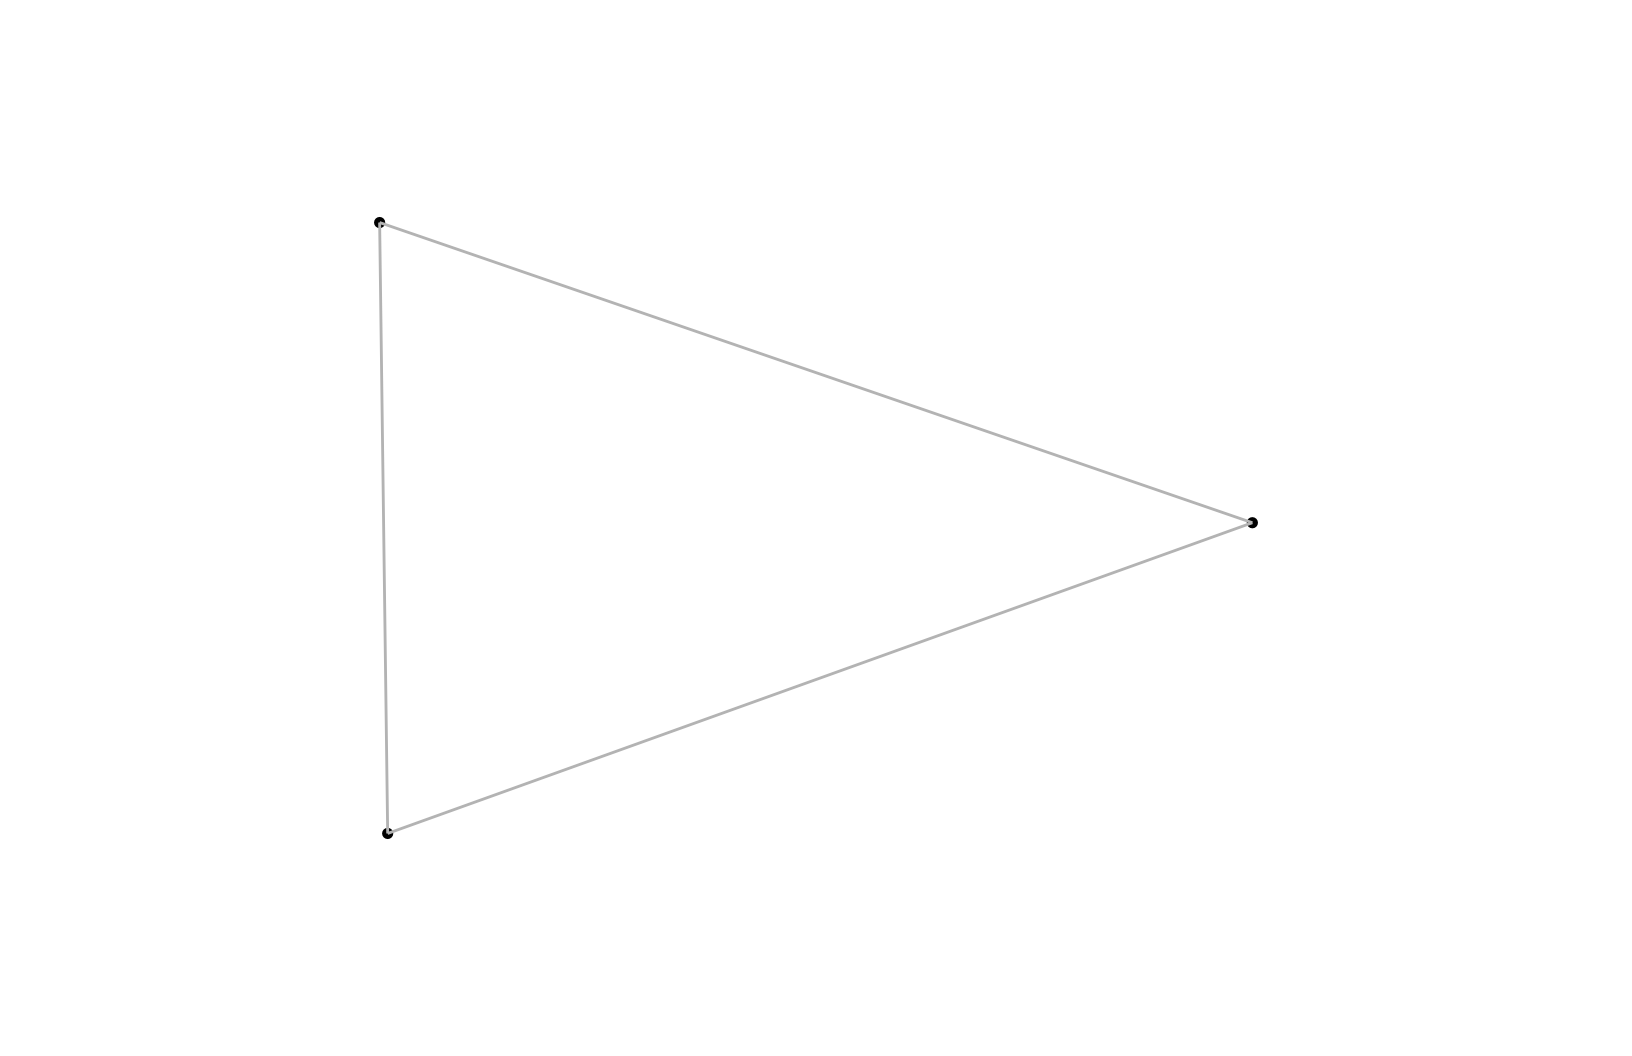
e <- data.frame(source = c("a", "a", "b"), target = c("b", "c", "c"))
g <- as_graph(e) |> layout_force(seed = 1)
g$nodes
#>   id         x         y
#> 1  a 0.8931809 0.5077668
#> 2  b 0.1068191 0.9500000
#> 3  c 0.1140646 0.0500000

as_graph(e) |>
  plotit() |>
  layout_force(seed = 1) |>
  mark_point(data = ~nodes) |>
  mark_rule(data = ~edges, colour = "grey70")